Recap of the Week
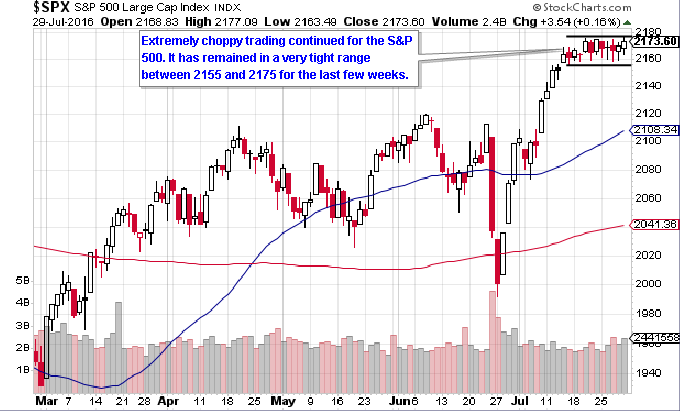
Stocks had mixed results last week. Trading was choppy and mostly non-eventful. The Nasdaq had a nice gain and the Russell 2000 did reasonably well. The S&P 500 was flat, however, while the Dow Jones had a loss.
Economic Data
The Chicago purchasing manager’s index, consumer confidence and new home sales were better-than-expected. However, initial jobless claims, pending home sales and durable goods orders came in below expectations.
TSP Funds
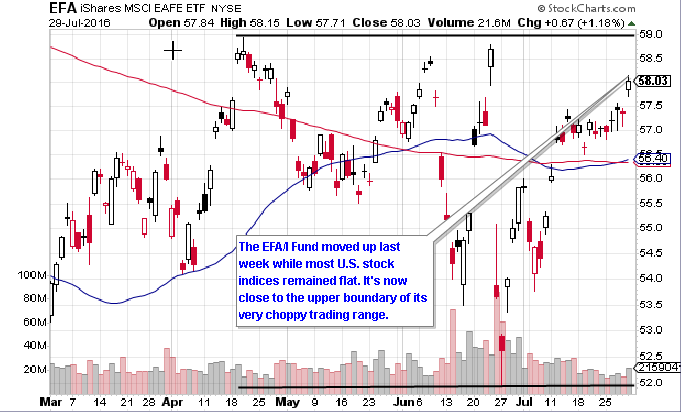
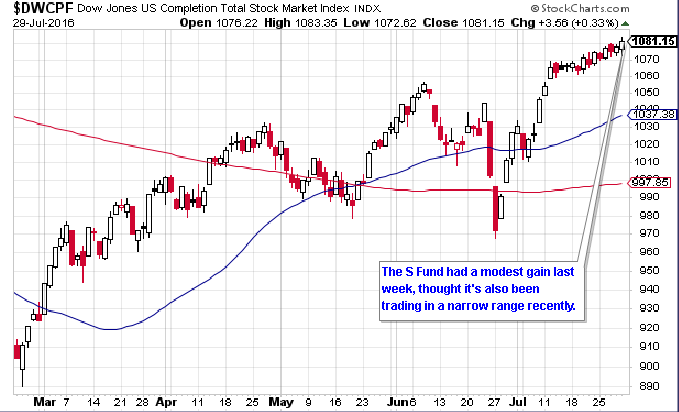
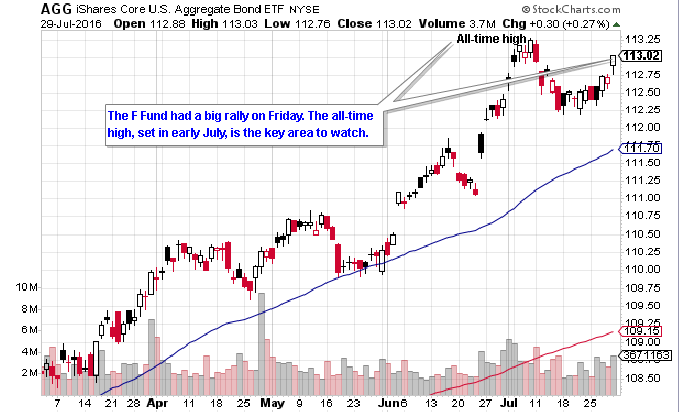
The I Fund had the biggest gain of 2.38%. The S Fund moved up 0.66%, while the F Fund gained 0.49%. The C Fund had a tiny loss of 0.05%.
Strategy Allocations
| Standard | 50 Day | BTD | LR |
|---|---|---|---|
| 50% G & 50% S | 100% G | 100% G | 75% G & 25% S |
BTD = Buy the Dip
LR = Low Risk
New Trades: None
See description of strategies here
TSP Fund Performance (7/29/16 YTD)
| G Fund | F Fund | C Fund | S Fund | I Fund |
|---|---|---|---|---|
| 1.06% | 6.17% | 7.70% | 8.26% | 1.46% |
Strategy Performance (7/29/16 YTD)
| Standard | 50 Day | BTD | LR |
|---|---|---|---|
| -1.95% | 8.38% | 5.68% | 0.50% |
Charts
1. Daily S&P 500 (C Fund Proxy)
2. Daily EFA (I Fund Proxy)
3. Daily Wilshire 4500 (S Fund Proxy)
4. Daily AGG (F Fund Proxy)
Get The Full Picture
Weekly Wrap Up
From Briefing.com