Quick Recap of the Week
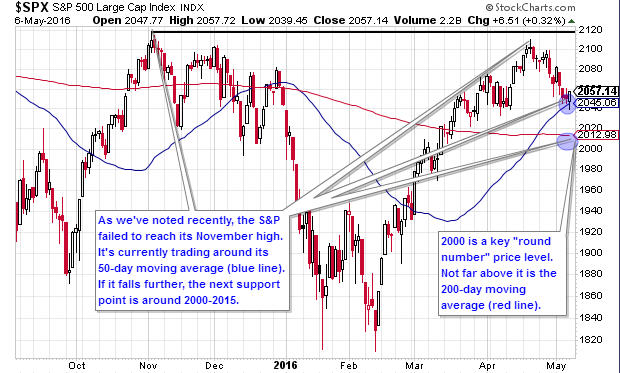
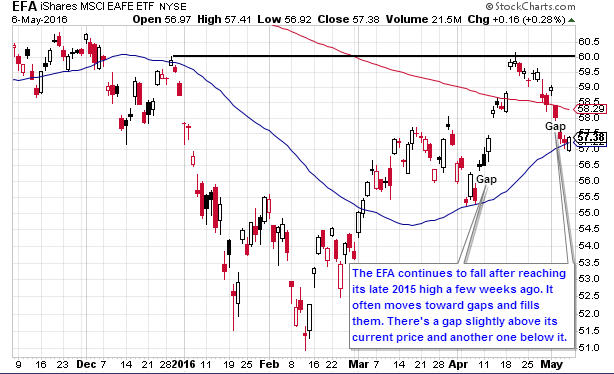
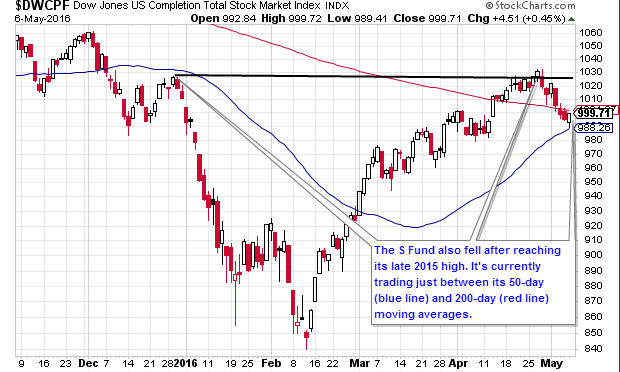
Stocks fell for the second straight week. Small-cap, technology and international stocks were hit the hardest. Larger blue chip stocks fared better.
Economic Data
Data releases were mostly negative. The ISM services index came in better-than-expected. However, payrolls, jobless claims and the ISM manufacturing index were worse-than-expected. In addition, most corporate earnings reports are down from the previous quarter.
TSP Funds
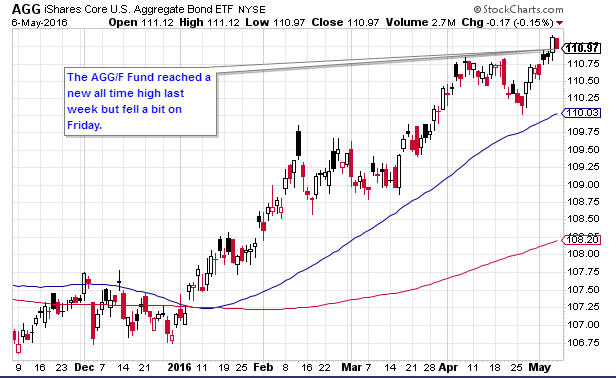
The I Fund had the biggest loss, falling 1.94%. The S Fund declined by 1.32%. The C Fund had a 0.33% loss, while the F Fund advanced by 0.17%.
Strategy Allocations
| Standard | 50 Day | BTD | LR |
|---|---|---|---|
| 50% G & 50% C | 100% G | 100% C | 75% G & 25% C |
BTD = Buy the Dip
LR = Low Risk
New Trades: None
See description of strategies here
TSP Fund Performance (5/6/2016 YTD)
| G Fund | F Fund | C Fund | S Fund | I Fund |
|---|---|---|---|---|
| 0.66% | 3.73% | 1.43% | -0.32% | -2.31% |
Strategy Performance (5/6/2016 YTD)
| Standard | 50 Day | BTD | LR |
|---|---|---|---|
| -4.92% | 2.35 | -0.47% | -1.25% |
Charts
1. Daily S&P 500 (C Fund Proxy)
2. Daily EFA (I Fund Proxy)
3. Daily Wilshire 4500 (S Fund Proxy)
4. Daily AGG (F Fund Proxy)
Get The Full Picture
Weekly Wrap Up
From Briefing.com