Some investing concepts are obvious. For example, if you want really high returns, you’ll probably have to take a lot of risk.
Other concepts aren’t as intuitive. Consider compound interest. The ability for money to grow through compounding is rather amazing. Albert Einstein reportedly called it the greatest mathematical discovery of all time.”
A drawdown is another concept that’s not so obvious. Drawdowns measure how much your account falls from a high point to a low point. While the concept is simple, the way drawdowns affect investments surprises many people.
An example
Let’s say your TSP account reached a peak of $10,000 in 2007. Then it fell to a low of $7,000 in 2009 before recovering. Your drawdown is 30% (the $3,000 loss divided by the high point of $10,000).
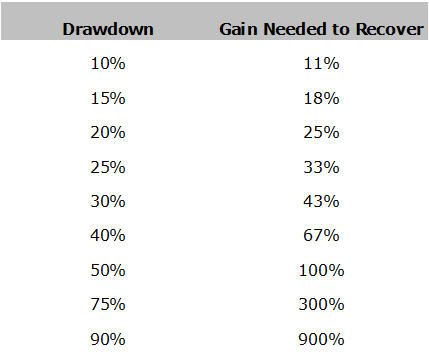
To grow your account back to $10,000, how much do you need to gain? Another 30%? No. You actually need a 43% increase. This is why drawdowns are so important. It can take years—or even decades—to recover from a large one.
The 50% drawdown…that happened twice in 7 years
What about a 50% drawdown? It’s happened to countless investors. The S&P 500 fell 49% from 2000 to 2002. Then it dropped 56% from 2007 to 2009.
After a 50% drawdown, you need a 100% gain to recover your loss. This is no easy task. After the S&P 500 peaked in 2000, it took over 7 years to reach its previous high.
When it finally reached this new high in October 2007, the stock market crashed again.
Although stocks rallied after the 2008 financial crisis, it took the S&P 500 another 6 years to fully recover. It really gets ugly when you consider both crashes. From 2000 to 2013, you’d have almost no gain from buying and holding the S&P 500.
The bigger the drawdown, the longer the recovery
 The table below reveals the surprising truth about drawdowns. It’s not too hard to recover from small losses. A 15% drawdown only requires an 18% recovery. A 25% drawdown is worse, requiring a 33% gain. This isn’t unreasonable, though. Stocks often rally this much within a year or two after a bear market.
Avoid the largest drawdowns
As drawdowns increase, the “Gain Needed to Recover” increases exponentially. When drawdowns reach 40%, you get into dangerous territory. If you’re near retirement, you may never recoup your loss.The real worst-case scenarios
The 2000-2002 and 2007-2009 stock crashes were devastating for some investors. This is especially true for those who sold stocks near the bottom and never reinvested in them. The “Lost Decade” (2000-2009) isn’t the worst thing to happen in the last century, however.
The Great Depression
The Dow Jones Industrial Average fell 90% during the first 4 years of the Great Depression. It took 25 years to return to its pre-Depression peak. Are we predicting another a crash like this? No, but remember, anything is possible in the financial markets.
Meanwhile in Japan
Japan’s stock index, the Nikkei, peaked in 1989 at around 40,000. Right now, it’s trading close to 20,000. After 25 years, it’s still trading 50% below its all-time high. Buy and hold has been a terrible strategy for that index.The “tech wreck’s” 15-year recovery
After peaking in March 2000, the Nasdaq fell over 80%. It didn’t reach a new high until very recently—April 2015. Once again, we see how devastating a large drawdown can be.
The common theme
What do these drawdowns have in common? They assume you buy-and-hold. Instead of exiting the market during corrections, buy-and-holders sit through the worst crashes. They may wait years to recoup their losses. Fortunately, you don’t have to do this. There is another way.

