All posts by John Pope
Why You Should Never Buy and Hold in a Market Crash (Market Timing Part 3)
Some investing concepts are obvious. For example, if you want really high returns, you’ll probably have to take a lot of risk.
Other concepts aren’t as intuitive. Consider compound interest. The ability for money to grow through compounding is rather amazing. Albert Einstein reportedly called it the greatest mathematical discovery of all time.”
A drawdown is another concept that’s not so obvious. Drawdowns measure how much your account falls from a high point to a low point. While the concept is simple, the way drawdowns affect investments surprises many people.
An example
Let’s say your TSP account reached a peak of $10,000 in 2007. Then it fell to a low of $7,000 in 2009 before recovering. Your drawdown is 30% (the $3,000 loss divided by the high point of $10,000).
To grow your account back to $10,000, how much do you need to gain? Another 30%? No. You actually need a 43% increase. This is why drawdowns are so important. It can take years—or even decades—to recover from a large one.
The 50% drawdown…that happened twice in 7 years
What about a 50% drawdown? It’s happened to countless investors. The S&P 500 fell 49% from 2000 to 2002. Then it dropped 56% from 2007 to 2009.
After a 50% drawdown, you need a 100% gain to recover your loss. This is no easy task. After the S&P 500 peaked in 2000, it took over 7 years to reach its previous high.
When it finally reached this new high in October 2007, the stock market crashed again.
Although stocks rallied after the 2008 financial crisis, it took the S&P 500 another 6 years to fully recover. It really gets ugly when you consider both crashes. From 2000 to 2013, you’d have almost no gain from buying and holding the S&P 500.
The bigger the drawdown, the longer the recovery
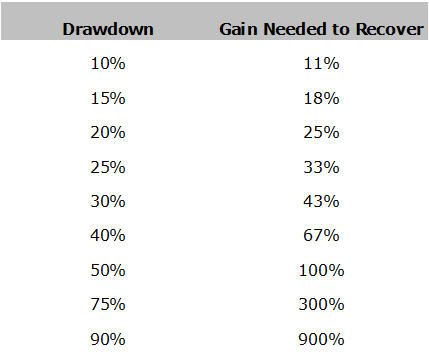 The table below reveals the surprising truth about drawdowns. It’s not too hard to recover from small losses. A 15% drawdown only requires an 18% recovery. A 25% drawdown is worse, requiring a 33% gain. This isn’t unreasonable, though. Stocks often rally this much within a year or two after a bear market.
Avoid the largest drawdowns
As drawdowns increase, the “Gain Needed to Recover” increases exponentially. When drawdowns reach 40%, you get into dangerous territory. If you’re near retirement, you may never recoup your loss.The real worst-case scenarios
The 2000-2002 and 2007-2009 stock crashes were devastating for some investors. This is especially true for those who sold stocks near the bottom and never reinvested in them. The “Lost Decade” (2000-2009) isn’t the worst thing to happen in the last century, however.
The Great Depression
The Dow Jones Industrial Average fell 90% during the first 4 years of the Great Depression. It took 25 years to return to its pre-Depression peak. Are we predicting another a crash like this? No, but remember, anything is possible in the financial markets.
Meanwhile in Japan
Japan’s stock index, the Nikkei, peaked in 1989 at around 40,000. Right now, it’s trading close to 20,000. After 25 years, it’s still trading 50% below its all-time high. Buy and hold has been a terrible strategy for that index.The “tech wreck’s” 15-year recovery
After peaking in March 2000, the Nasdaq fell over 80%. It didn’t reach a new high until very recently—April 2015. Once again, we see how devastating a large drawdown can be.
The common theme
What do these drawdowns have in common? They assume you buy-and-hold. Instead of exiting the market during corrections, buy-and-holders sit through the worst crashes. They may wait years to recoup their losses. Fortunately, you don’t have to do this. There is another way.
Newsletter 6/19/15
Newsletter 6/12/15
Newsletter 6/5/15
Newsletter 5/29/15
Newsletter 5/22/15
Three Reasons You Shouldn’t Buy-and-Hold (Market Timing Part 2)
“Impossible!” they say. “You can’t time the market.” “Just buy and hold.” “It’s time in the market—not timing the market—that’s important.”
We’ve heard these sayings many times. Market timing is supposed to be impossible. But this calls to mind another saying: “If you repeat a lie often enough, people will believe it.”
Defining our terms—what is market timing?
What is “market timing”? For us, it’s holding stocks when they’re moving up and moving to safety (the G or F Fund) when they’re not. This style is known as trend-following or momentum investing. This is the backbone of our system, though it also incorporates seasonality and other factors.
Once again, we use a system for this—not judgment calls or gut feel. Our system is data-driven and clearly answers the question “which fund(s) should you invest in?”
What market timing isn’t
No one can consistently call the market’s tops and bottoms. Therefore, we don’t make predictions. Nor do we make decisions based on news or world events.
Instead, we respond to what the TSP funds are already doing. Are they moving up, down or sideways? We measure this in a time-tested way and invest accordingly.
Buy and holders are right…partially
Most of us are naturally bad market timers. “Gut feel investing” rarely turns out well. So the buy-and-holders have a valid point. Studies show that most people are very poor timers.
Why do most investors do so poorly? Very few use a consistent, systematic approach. Instead, they buy stocks near market tops—after everyone else has bought. The dot com bubble is a classic example.
In addition, they usually don’t sell stocks until losses are devastating. Think about the 2002-2003 and 2008-2009 crashes. After selling, these investors are shell-shocked. It they buy stocks again, it’s near the top of another huge rally. And the cycle repeats.
The solution
So are the buy-and-holders right? No. The choice doesn’t have to be gut feel investing or buy-and-hold. Market timing systems offer another alternative.
Unlike people, systems don’t have emotions. They don’t panic. They don’t get greedy. They just analyze market data and suggest the best course of action.
Our system is proprietary and designed specifically for the TSP funds. We’ll talk more about in future articles. For now, let’s look at some other market-beating systems.
Example 1: Holy Grail
Advisor Theodore Wong tested his “Holy Grail” system on the S&P 500 from 1871 to 2012. This 142-year period is significant. Many buy-and-hold studies start after the 1940s, conveniently leaving out the Great Depression.
Wong’s system is very simple. He uses one indicator—a 6-month moving average. The result? It produced a 10.6% compound annual growth rate compared to 8.9% for buy-and-hold.
If you invested $1 in 1871, it would grow to $1.3 million. This is almost 8 times more than buy-and-hold, which grew to $164,000.
The “Holy Grail” reduced risk, too. Its standard deviation was one-third less than buy-and-hold’s. As we’ll see in our next blog post, avoiding the worst bear markets is crucial for your long-term results.
The 200 year test…and more
Capital Fund Management, a research firm, went even further. They tested their trend-following systems on stocks, currencies, commodities and bonds going back to 1800. Their conclusion:
We establish the existence of anomalous excess returns based on trend following strategies across four asset classes…and over very long time scales…We have found that the trend has been a very persistent feature…one of the most statistically significant anomalies in financial markets.
In plain English, trend-following beat buy-and-hold in a 200+ year test…in four different kinds of investments.
The authors of a recent book went further still. They did a similar test going back 800 years—with similar results. They also found that trend-following produced a superior performance.
Even a buy-and-holder admits…
Even Jeremy Siegel, a major advocate of buy-and-hold, gives market timing some credit. Siegel is a well-known author and Professor of Finance at the Wharton School.
In one of his books, he tested the popular 200-day moving average on the Dow Jones Industrial Average. His conclusion? This simple system improved risk-adjusted returns, even after considering taxes and commissions—things you don’t worry about in your TSP.
Trend-following’s relatives
Momentum investing, a close-cousin of trend-following, has a similar record of beating buy-and-hold. This is part of the approach we use. Eugene Fama, a Nobel-prize winning buy-and-holder, calls is it “the premier anomaly.”
The London Business School and AQR, a global investment firm, have tested momentum strategies for 80+ years. Both found that momentum strategies yielded superior returns.
A season for everything
When it comes to beating buy-and-hold, trend-following and momentum have the best track records. There are other successful approaches, however. One seasonal approach has outperformed buy-and-hold for over 300 years.
The verdict
Market timing can work—if you do it correctly. There’s strong evidence that trend-following and momentum strategies can increase returns and lower risk. Don’t listen to slogans about market timing. Look at the data instead.
Newsletter 5/15/15