Tag Archives: TSP Funds

What If I’m About to Retire?

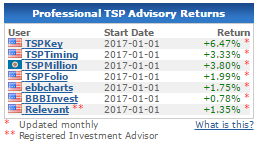
Before getting to the topic, here’s a brief look at our performance. Our return through the end of April was 6.47%. We remain well ahead of other services tracked by TSPCenter in 2017:
Retirement question

We sometimes get questions from people nearing retirement. They’re usually more risk-averse and wonder if our service is a good fit.

Here’s a typical question: “I’m 4 years from retirement. I currently have 70% in L2040, 20% in G and 10% in F Fund. Should I use TSPKey or stick with my allocation until I retire?” (Note: this isn’t an actual question, but we’ve received similar ones.)

Before addressing this, there are a few things to note. First, we can’t give personalized TSP advice. Second, every situation is different. There’s no one-size-fits-all answer.

Finally, we’ll assume you have a traditional TSP, not a Roth. With a traditional TSP, you can withdraw funds without penalty at age 59 1/2 while employed by the Federal Government or uniformed services.

Here are a few questions for those nearing retirement:

1) Do you need immediate access to your TSP funds when you retire or reach age 59 1/2?  If not, how quickly will you withdraw your TSP funds?

2) Are you trying to protect your TSP principal from a market crash? If so, are you still willing to take some risk?

3) If you plan to transfer your TSP to another investment, have you compared the benefits?

Not all risks are the same

Our service is different than buy-and-hold investing. We sometimes have a 100% stock fund allocation, so it certainly isn’t risk-free. However, it’s not the same as permanently buying and holding stocks. We sometimes reduce our stock allocation for two reasons:

1) The stock market’s long-term trend turns negative
2) It’s a part of the year when stocks don’t perform as well historically

We do this to reduce risk. Backtesting shows it kept our losses much smaller than buy-and-hold in 2008. Because of these measures, we never remain 100% invested in stocks for an entire year.

You may not need to change your strategy

If you’d like to preserve your TSP as long as possible, you can take required minimum distributions (RMDs). You can wait until you’re age 70 1/2 before starting RMDs. According to this publication, your first RMD is about 3.65% of your account. When you reach 80, your RMD will be 5.35% of your account.

In normal market conditions, the stock market should outgrow RMDs–at least until your late 80s. The long-term annualized return of the S&P 500 is about 9%.

Of course, there may be down years. The market has bounced back quickly after most corrections, however

But I need to preserve my principal

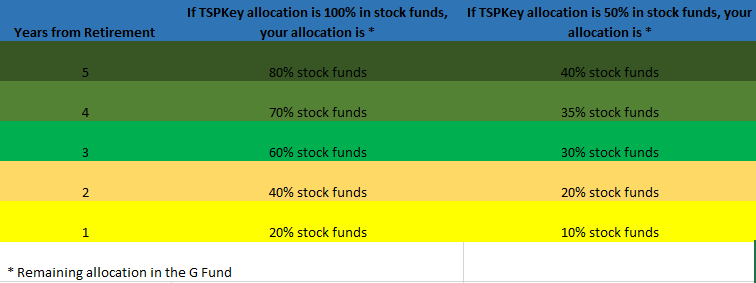
Let’s say you want access to your TSP in a few years. You also want to preserve most of your account. Since no one knows when a bear market will show up, you want to reduce your exposure to stock funds.

The chart below is a possible solution. Again, it’s not a customized plan for all investors. But it may give you some ideas. Note: TSPKey is always invested either 100%, 50% or 0% in stock funds (C, S and I). That’s why we covered the 100% and 50% scenarios in the table.
Bottom line

To answer the question we started with, those nearing retirement can definitely use our service. If you’re risk-averse, you can tailor our allocations to protect your principal
Newsletter 12/23/16 (Updated 12/29/16)

TSP Funds
The F Fund had the week’s biggest gain of 0.47%. It was followed by the S Fund’s 0.40% advance and the I Fund’s 0.39% gain. The C Fund moved up by 0.30%.

Strategy Allocations

Standard  50 Day    BTD          LR
50%C / 50%S 100%G 100%G 50%G / 25%C / 25%S


BTD = Buy the Dip
LR = Low Risk
New Trades: For 50 Day, do an interfund transfer to 100% G Fund before noon EST on Friday, 12/30/16. For 50 Day, we recommend keeping your contribution allocation in 100% G Fund at all times.
See description of strategies here

TSP Fund Performance (12/23/16 YTD)

G Fund F Fund C Fund S Fund I Fund
1.77% 2.23% 13.23% 17.42% 1.48%


Strategy Performance (12/23/16 YTD)

Standard 50 Day  BTD   LR
4.12% 7.43% 7.10% 3.95%

Charts
1.  Daily S&P 500 (C Fund Proxy)

2.  Daily EFA (I Fund Proxy)

3.  Daily Wilshire 4500 (S Fund Proxy)

4.  Daily AGG (F Fund Proxy)

Get The Full Picture

Weekly Wrap Up

From Briefing.com

Newsletter 12/17/16 (Updated 12/19/16)

TSP Funds
The S Fund had the week’s largest loss of 1.37%. It was followed by the F Fund’s 0.60% decline and the I Fund’s 0.55% loss. The C Fund fell by a tiny 0.03%.

Strategy Allocations

Standard  50 Day    BTD          LR
50%C / 50%S 100%S 100%G 50%G / 25%C / 25%S


BTD = Buy the Dip
LR = Low Risk
New Trades: Interfund transfer for 50 Day to 100% S Fund before noon EST on Tuesday, 12/20/16. Since 50 Day is a short-term strategy, we recommend leaving your contribution allocation in 100% G Fund..
See description of strategies here

TSP Fund Performance (12/16/16 YTD)

G Fund F Fund C Fund S Fund I Fund
1.72% 1.76% 12.89% 16.95% 1.09%


Strategy Performance (12/16/16 YTD)

Standard 50 Day  BTD   LR
3.76% 8.15% 7.05% 3.74%

Charts
1.  Daily S&P 500 (C Fund Proxy)

2.  Daily EFA (I Fund Proxy)

3.  Daily Wilshire 4500 (S Fund Proxy)

4.  Daily AGG (F Fund Proxy)

Get The Full Picture

Weekly Wrap Up

From Briefing.com

Newsletter 12/3/16

Recap of the Week
Following a huge, month-long rally, most stock indices had losses last week. The Dow managed to make a tiny gain, but the S&P 500 fell by 1%. The Russell 2000 and Nasdaq suffered larger losses. The odds of a December interest rate hike remain in the 95% range.

TSP Funds
The F Fund had a tiny gain of 0.07%, which was better than any of the stock funds. The S Fund had the biggest loss of 1.90%. It was followed by the C Fund’s decline of 0.90%, and the I Fund’s 0.23% loss.

Strategy Allocations

Standard  50 Day    BTD          LR
50%C / 50%S 100%G 100%G 50%G / 25%C / 25%S


BTD = Buy the Dip
LR = Low Risk
New Trades: For 50 Day, do an interfund transfer to 100% G Fund before noon EST on Monday, 12/5/16. For 50 Day, we recommend keeping your contribution allocation in 100% G Fund at all times.
See description of strategies here

TSP Fund Performance (12/2/16 YTD)

G Fund F Fund C Fund S Fund I Fund
1.63% 2.65% 9.50% 13.54% -1.23%

L 2050 L 2040 L 2030 L 2020 L Income
6.25%  5.77%  5.23%  4.18%    2.88%


Strategy Performance (12/2/16 YTD)

Standard 50 Day  BTD   LR
0.68% 6.61% 6.96% 2.14%

Charts
1.  Daily S&P 500 (C Fund Proxy)

2.  Daily EFA (I Fund Proxy)

3.  Daily Wilshire 4500 (S Fund Proxy)

4.  Daily AGG (F Fund Proxy)

Get The Full Picture

Weekly Wrap Up

From Briefing.com

Newsletter 9/23/16

Recap of the Week
The stock market moved up last week. The main driver was the Federal Reserve meeting on Wednesday. The Fed chose to hold their interest rate steady. Stocks rallied after the decision, and moved up again on Thursday. The major indices ended the week with gains ranging from 0.8% (Dow Jones) to 2.6% (Russell 2000).

Economic Data
Jobless claims and the housing market index came in better-than-expected. The PMI manufacturing index, existing home sales and housing starts came in below expectations.

TSP Funds
All of the TSP Funds moved up after the Fed’s decision. The I Fund was the big winner with a 3.15% weekly gain. The S Fund advanced by 2.20% while the C Fund gained 1.20%. The F Fund moved up by 0.54%.

Strategy Allocations

Standard  50 Day    BTD          LR
50% G & 50% C 100% G 100% C 75% G & 25% C


BTD = Buy the Dip
LR = Low Risk
New Trades: None.
See description of strategies here

TSP Fund Performance (9/23/16 YTD)

G Fund F Fund C Fund S Fund I Fund
1.29% 5.94% 7.65% 10.05% 3.48%


Strategy Performance (9/23/16 YTD)

Standard 50 Day  BTD   LR
-1.51% 8.91% 5.19% 0.84%

Charts
1.  Daily S&P 500 (C Fund Proxy)

2.  Daily EFA (I Fund Proxy)

3.  Daily Wilshire 4500 (S Fund Proxy)

4.  Daily AGG (F Fund Proxy)

Get The Full Picture

Weekly Wrap Up

From Briefing.com

Newsletter 9/9/16

Recap of the Week

Stocks spent most of last week in their recent trading range. They fell sharply on Friday, however. The main drivers were a North Korean nuclear test and remarks from Boston Fed President Eric Rosengren. Mr. Rosengren suggested that a gradual interest rate hike may be in order.

This sent stocks into a sharp selloff on Friday. All of the major stock indices fell between 2.2% and 2.6% on a weekly basis. Bonds fell as well, both in the U.S. and globally.

Economic Data
Durable goods and jobless claims came in better-than-expected. The ISM and PMI services indexes both fell from the prior month’s readings, however.

TSP Funds
The S Fund had the week’s biggest loss of 2.54%. The C Fund fell 2.36% while the I Fund dropped by 1.00%. The F Fund had a 0.39% loss.

Strategy Allocations

Standard  50 Day    BTD          LR
50% G & 50% C 100% G 100% C 75% G & 25% C


BTD = Buy the Dip
LR = Low Risk
New Trades: None.
See description of strategies here

TSP Fund Performance (9/9/16 YTD)

G Fund F Fund C Fund S Fund I Fund
1.23% 5.49% 5.75% 7.46% 1.99%


Strategy Performance (9/9/16 YTD)

Standard 50 Day  BTD   LR
-2.42% 8.84% 3.33% 0.34%

Charts
1.  Daily S&P 500 (C Fund Proxy)

2.  Daily EFA (I Fund Proxy)

3.  Daily Wilshire 4500 (S Fund Proxy)

4.  Daily AGG (F Fund Proxy)

Get The Full Picture

Weekly Wrap Up

From Briefing.com

Newsletter 9/2/16 (Updated 9/7/16)

Recap of the Week
Stocks moved up moderately last week. Trading remained choppy, but volume picked up. Most likely we’ll see larger moves after Labor Day, as the “summer doldrums” season has ended.

Economic Data
Consumer confidence, personal spending and pending home sales were better-than-expected. On the negative side, ISM Manufacturing, the Chicago Purchasing Manager’s Index and Friday’s employment data came in below their forecasts. Stocks rallied on the weak employment data, however. Traders believe it may discourage the Fed from raising interest rates in the near future.

TSP Funds
The S Fund gained 1.34% while the I Fund moved up by 1.28%. The C Fund gained 0.56% and the F Fund advanced by 0.18%.

Strategy Allocations

Standard  50 Day    BTD          LR
50% G & 50% C 100% G 100% C 75% G & 25% C


BTD = Buy the Dip
LR = Low Risk
New Trades: Interfund transfer for 50 Day to 100% G Fund before noon EST on Thursday, 9/8/16.
See description of strategies here

TSP Fund Performance (9/2/16 YTD)

G Fund F Fund C Fund S Fund I Fund
1.19% 5.90% 8.31% 10.26% 3.02%


Strategy Performance (9/2/16 YTD)

Standard 50 Day  BTD   LR
-1.27% 8.74% 5.83% 0.91%

Charts
1.  Daily S&P 500 (C Fund Proxy)

2.  Daily EFA (I Fund Proxy)

3.  Daily Wilshire 4500 (S Fund Proxy)

4.  Daily AGG (F Fund Proxy)

Get The Full Picture

Weekly Wrap Up

From Briefing.com

Newsletter 8/26/16 (Updated 8/30/16)

Recap of the Week
Stocks continued trading in a tight range last week. The range expanded on Friday, however, as Janet Yellen and other Federal Reserve members spoke. Because of their comments, the odds of an interest rate hike went up in the futures markets. This caused stocks and bonds to end the week with modest losses.

Economic Data
Durable goods, new home sales and jobless claims were better-than-expected. However, consumer sentiment, PMI manufacturing and existing home sales came in below their forecasts.

TSP Funds
The C Fund had the biggest loss of 0.66% while the I Fund fell by 0.62%. The F Fund fell by 0.15% and the S Fund had a 0.09% loss.

Strategy Allocations

Standard  50 Day    BTD          LR
50% G & 50% C 100% C 100% C 75% G & 25% S


BTD = Buy the Dip
LR = Low Risk
New Trades: Interfund transfer and new contribution allocation for Standard to 50% G Fund and 50% C Fund and for LR to 75% G Fund and 25% C Fund before noon EST on Wednesday, 8/31/16.
See description of strategies here

TSP Fund Performance (8/26/16 YTD)

G Fund F Fund C Fund S Fund I Fund
1.17% 5.71% 7.71% 8.80% 1.72%


Strategy Performance (8/26/16 YTD)

Standard 50 Day  BTD   LR
-1.64% 8.50% 5.79% 0.71%

Charts
1.  Daily S&P 500 (C Fund Proxy)

2.  Daily EFA (I Fund Proxy)

3.  Daily Wilshire 4500 (S Fund Proxy)

4.  Daily AGG (F Fund Proxy)

Get The Full Picture

Weekly Wrap Up

From Briefing.com

Newsletter 8/19/16

Recap of the Week
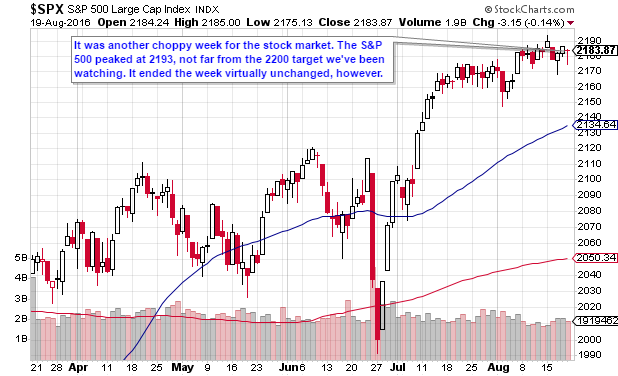
Listless trading continued last week. The major indices barely moved, except for a modest rally in the Russell 2000 (small-cap stocks). Trading volume remained low.

Economic Data
Initial jobless claims, housing starts and industrial production were better-than-expected. On the negative side, mortgage applications and the NY manufacturing index came in below their estimates.

TSP Funds
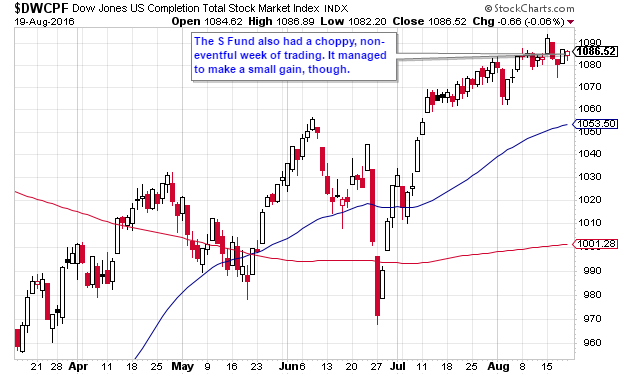
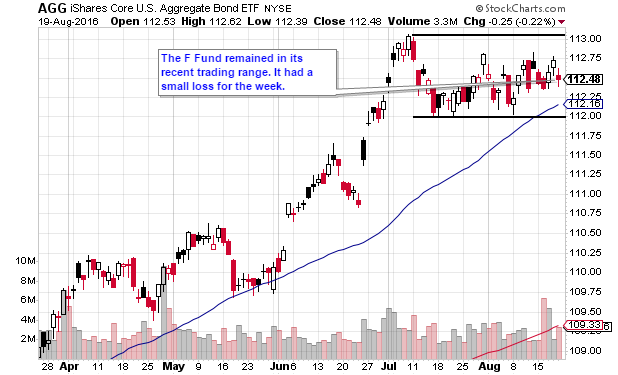
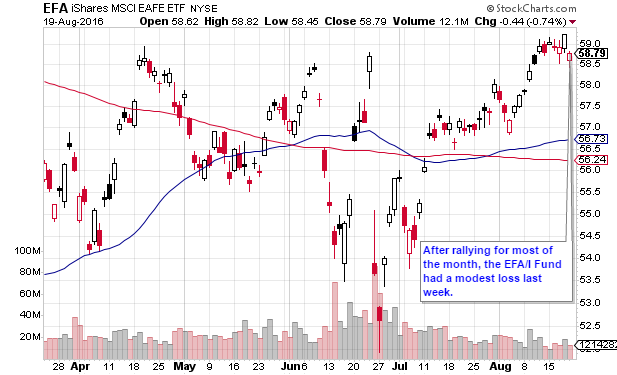
The S Fund gained 0.31% while the C Fund had a 0.06% gain.  The F Fund fell by 0.18% and the I Fund had a 0.58% loss.

Strategy Allocations

Standard  50 Day    BTD          LR
50% G & 50% S 100% G 100% G 75% G & 25% S


BTD = Buy the Dip
LR = Low Risk
New Trades: None.
See description of strategies here

TSP Fund Performance (8/19/16 YTD)

G Fund F Fund C Fund S Fund I Fund
1.14% 5.87% 8.42% 8.91% 2.35%


Strategy Performance (8/19/16 YTD)

Standard 50 Day  BTD   LR
-1.61% 8.47% 5.76% 0.71%

Charts
1.  Daily S&P 500 (C Fund Proxy)

2.  Daily EFA (I Fund Proxy)

3.  Daily Wilshire 4500 (S Fund Proxy)

4.  Daily AGG (F Fund Proxy)

Get The Full Picture

Weekly Wrap Up

From Briefing.com

Newsletter 8/12/2016

Recap of the Week
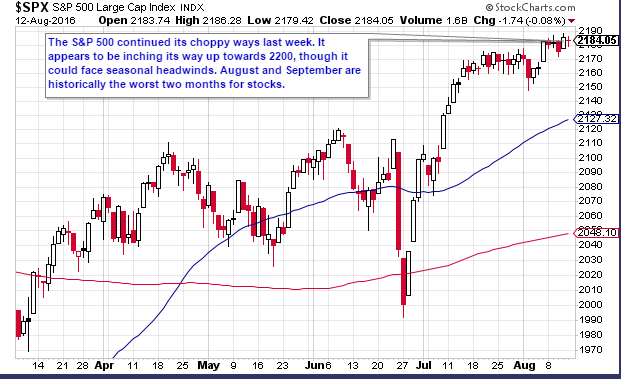
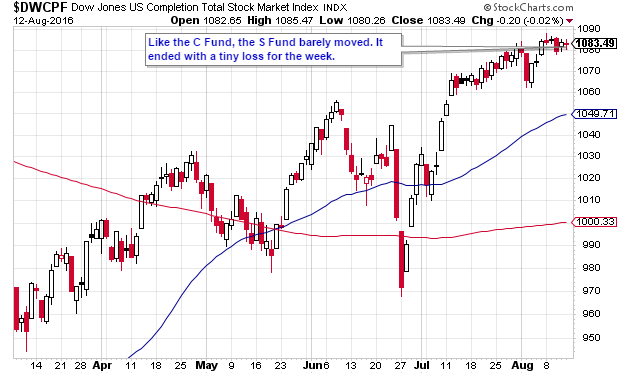
It was another uneventful week for the stock market. The major U.S. indices continued to trade in narrow ranges with very little volume. The Dow, S&P 500 and Nasdaq had very small gains, while the Russell 2000 ended the week with a fractional loss.

Economic Data
On the positive side, jobless claims fell. In addition, job openings increased, as did the NFIB’s small business optimism survey.

However, retail sales and consumer sentiment were both worse-than-expected.

TSP Funds
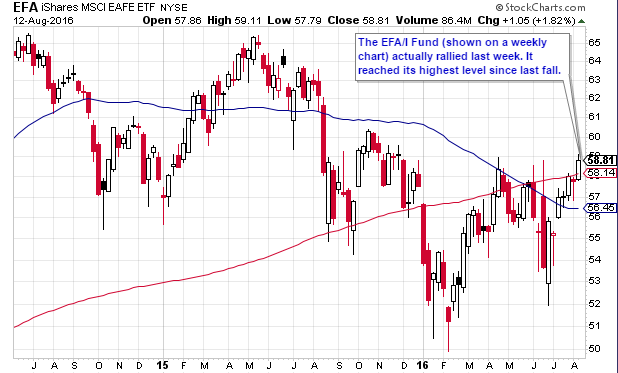
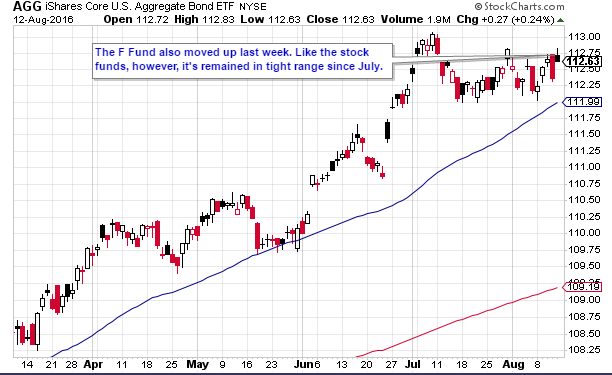
The I Fund had the only big move of the week. It moved up by 2.85%. The F Fund followed with a 0.42% gain. The C Fund advanced by 0.12% while the S Fund fell by 0.02%.

Strategy Allocations

Standard  50 Day    BTD          LR
50% G & 50% S 100% G 100% G 75% G & 25% S


BTD = Buy the Dip
LR = Low Risk
New Trades: None.
See description of strategies here

TSP Fund Performance (8/12/16 YTD)

G Fund F Fund C Fund S Fund I Fund
1.11% 6.06% 8.36% 8.57% 2.94%


Strategy Performance (8/12/16 YTD)

Standard 50 Day  BTD   LR
-1.78% 8.44% 5.73% 0.61%

Charts
1.  Daily S&P 500 (C Fund Proxy)

2.  Daily EFA (I Fund Proxy)

3.  Daily Wilshire 4500 (S Fund Proxy)

4.  Daily AGG (F Fund Proxy)

Get The Full Picture

Weekly Wrap Up

From Briefing.com