Quick Recap of the Week
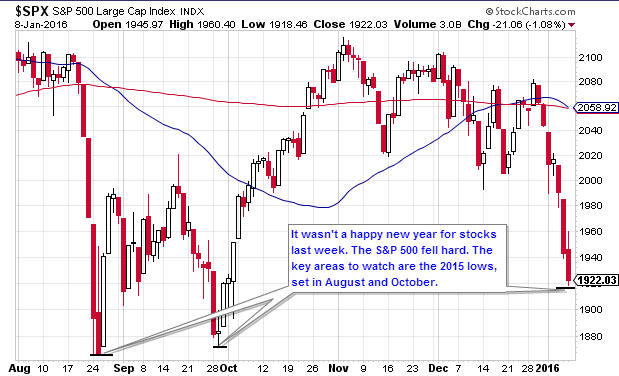
Stocks fell sharply last week. The main cause was a large drop in the Chinese stock market. Falling oil prices added to the fear.
While these are concerns, they aren’t new. The Chinese stock market drop started 6 months ago. In the long term, it’s part of a much bigger correction that began in 2007.
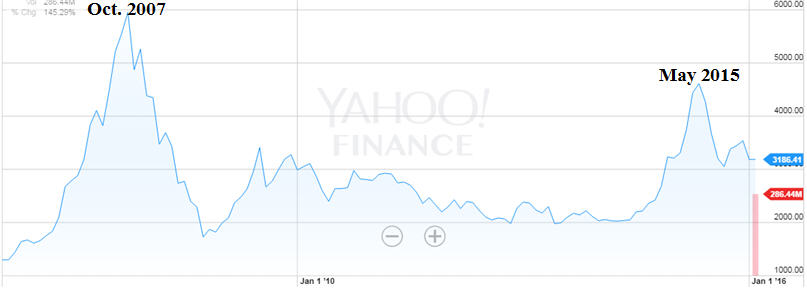
Likewise, crude oil began to crash in mid-2014. While it’s fallen from almost $110 to under $33/barrel, the S&P 500 is virtually unchanged since that time.
The relationship between oil and stock prices is complex. Low oil and gas prices benefit individuals and businesses, something that’s been downplayed recently. This academic study shows rapidly rising (not falling) oil prices most often lead to stock market declines.
As expected, some are calling for a crash based on recent events. This article gives a more balanced view. At this point, there’s not enough evidence to claim we’re repeating 2008.
Economic Data
On the positive side, several employment indicators were better-than-expected. These included nonfarm payrolls (new jobs) and initial jobless claims.
While employment was strong, manufacturing was weak. The PMI and ISM Manufacturing indexes were worse-than-expected. Factory orders were also down for the month.
TSP Funds
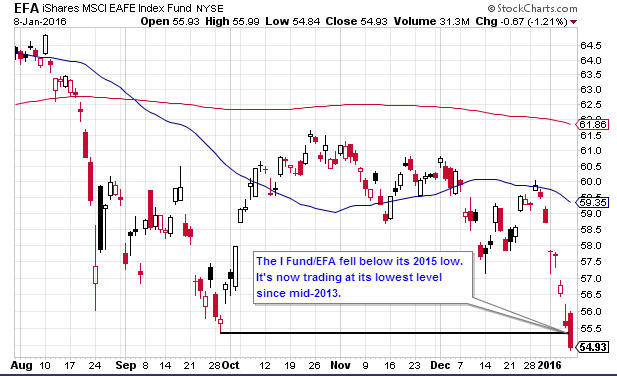
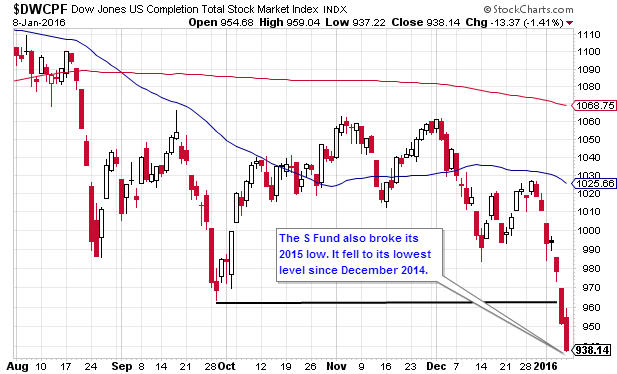
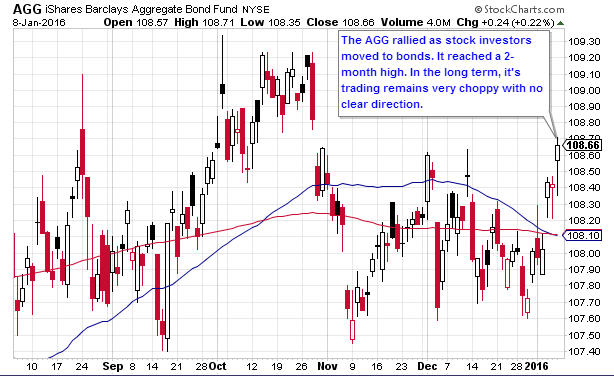
All three stock funds were hit hard. The S, I and C Funds fell 7.17%, 6.38% and 5.90%, respectively. The F Fund gained as bonds were seen as a safe haven.
YTD Return as of 1/8/16: -7.17%
Current allocation: 100% S Fund
New Trades: None.
TSP Fund Performance (1/8/2016 YTD)
| G Fund | F Fund | C Fund | S Fund | I Fund |
|---|---|---|---|---|
| 0.05% | 0.66% | -5.90% | -7.17% | -6.38% |
Charts
1. Daily S&P 500 (C Fund Proxy)
2. Daily EFA (I Fund Proxy)
3. Daily Wilshire 4500 (S Fund Proxy)
4. Daily AGG (F Fund Proxy)
Get The Full Picture
Weekly Wrap Up
From Briefing.com