Quick Recap of the Week
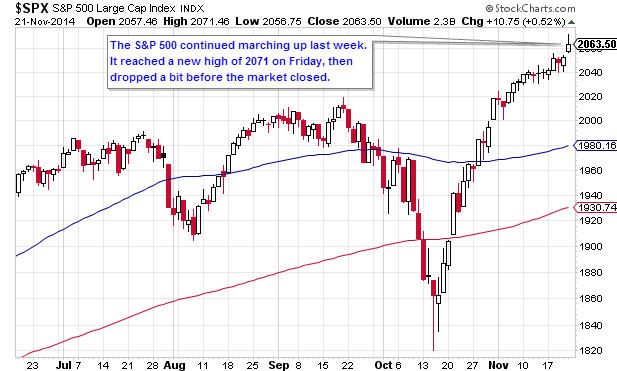
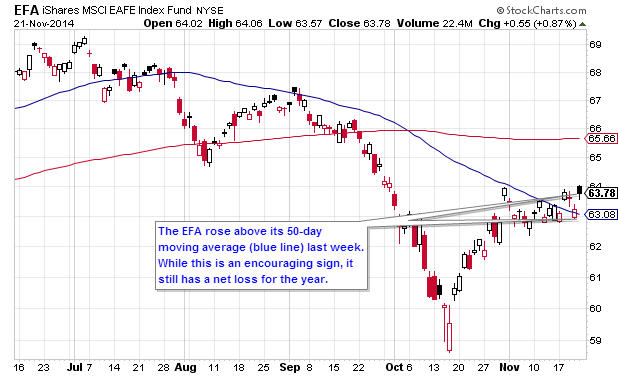
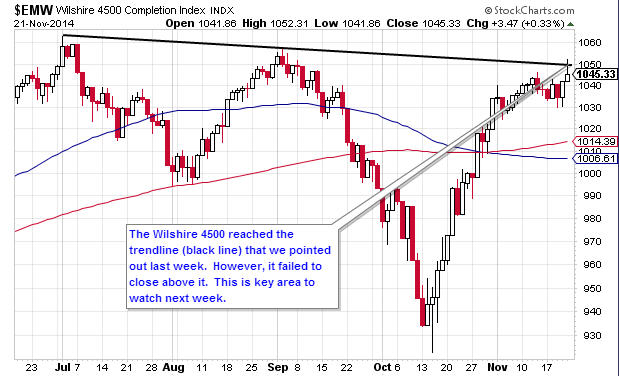
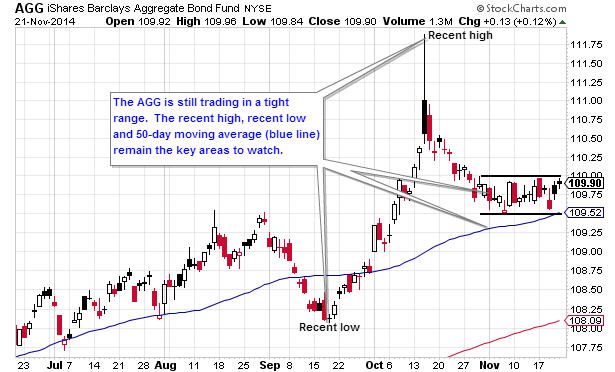
It was another good week for stocks. In the TSP world, the C Fund was the best performer, moving up 1.21%. The I Fund gained 1.03% while the S Fund rose by 0.64%. The bond market remained flat, however, as the F Fund only advanced by 0.09%.
Around this time of year, there’s a lot of talk about the so-called “Santa Rally.” Unfortunately, the discussion is often muddled. What exactly is the Santa Rally? When does it start? When does it end?
When it come to investing, we like to define things precisely and mechanically. Here’s our definition of the Santa Rally:
On the Monday before Thanksgiving, invest 100% of your funds in the S&P 500 at the market’s close.
On the third trading day in January, sell 100% of your S&P 500 holdings at the market’s close.
We tested this strategy from 1970 to 2013. Here’s what we found:
- 80% of the time, the “Santa Rally” was a winning trade.
- The average trade gained 3.01%.
- During these trades, the S&P 500 had a compound annual return of 28.37%. During the entire period of 1970-2013, the S&P’s compound annual return was 6.93%. Compared to the entire year, stocks gained over 4 times as much during this period.
- The maximum drawdown (largest loss) was 10.77%.
Our conclusion? During the period that’s roughly between Thanksgiving and New Year’s Day, stocks perform much better than they do the rest of the year. It’s not a perfect or guaranteed strategy, but nothing is in the investment world.
- YTD Return as of 11/21/14: 2.29%
- Current allocation: 100% C Fund as of 11/3/14
- New Trades: None
TSP Fund Performance (11/21/2014 YTD)
| G Fund | F Fund | C Fund | S Fund | I Fund |
|---|---|---|---|---|
| 2.08% | 5.92% | 13.79% | 6.56% | -1.68% |
Charts
1. Daily S&P 500 (C Fund Proxy)
2. Daily EFA (I Fund Proxy)
3. Daily Wilshire 4500 (S Fund Proxy)
4. Daily AGG (F Fund Proxy)
Get The Full Picture
Weekly Wrap Up
From Briefing.com