Quick Recap of the Week
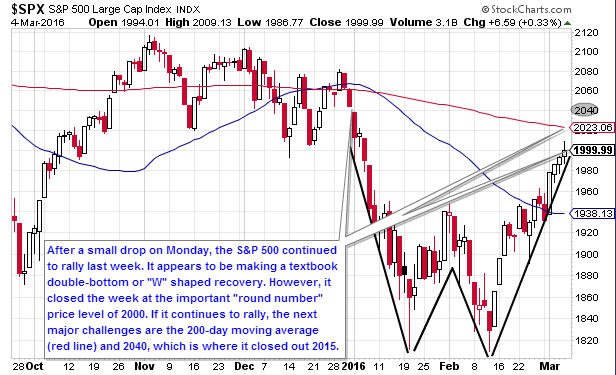
Stocks rose for the third straight week. It ended with the S&P 500 closing a fraction below 2000 on Friday. So far, stocks haven’t run into resistance since they began recovering in mid-February. However, the key price level of 2000 could be a major test.
Economic Data
Employment data was better-than-expected, as was the ISM Non-Manufacturing index, construction spending and factory orders. On the negative side, the PMI Services Index and pending home sales fell.
TSP Funds
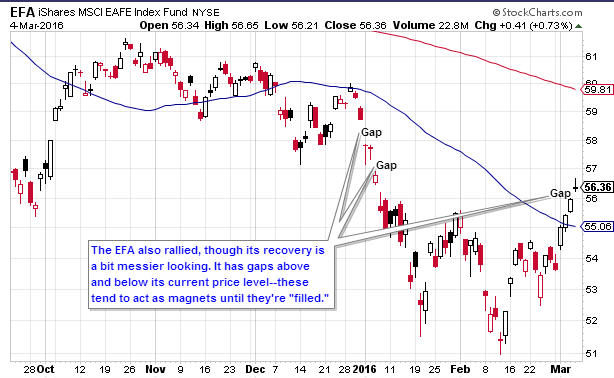
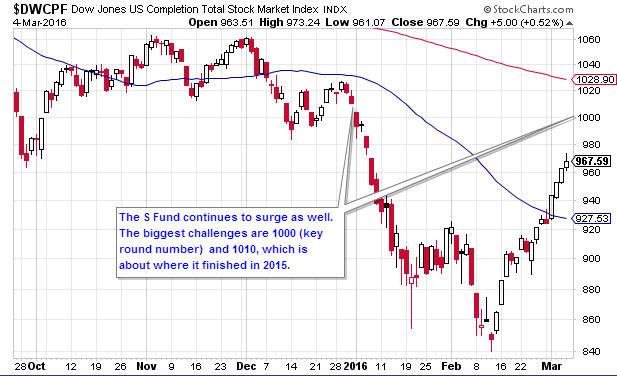
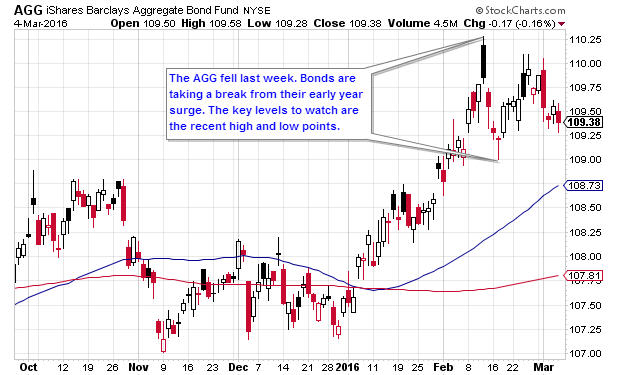
The I Fund led the TSP with a 4.66 gain, followed closely by the S Fund, which rose 4.44%. The C Fund increased by 2.71%, while the F Fund fell 0.21%.
Strategy Allocations
| Standard | 50 Day | BTD | LR |
|---|---|---|---|
| 50% G & 50% C | 100% G | 100% G | 75% G & 25% C |
BTD = Buy the Dip
LR = Low Risk
New Trades: none
See description of strategies here
TSP Fund Performance (3/4/2016 YTD)
| G Fund | F Fund | C Fund | S Fund | I Fund |
|---|---|---|---|---|
| 0.36% | 1.82% | -1.71% | -3.87% | -4.01% |
Strategy Performance (3/4/2016 YTD)
| Standard | 50 Day | BTD | LR |
|---|---|---|---|
| -6.73% | 1.43 | 0.36% | -2.36% |
Charts
1. Daily S&P 500 (C Fund Proxy)
2. Daily EFA (I Fund Proxy)
3. Daily Wilshire 4500 (S Fund Proxy)
4. Daily AGG (F Fund Proxy)
Get The Full Picture
Weekly Wrap Up
From Briefing.com