Quick Recap of the Week
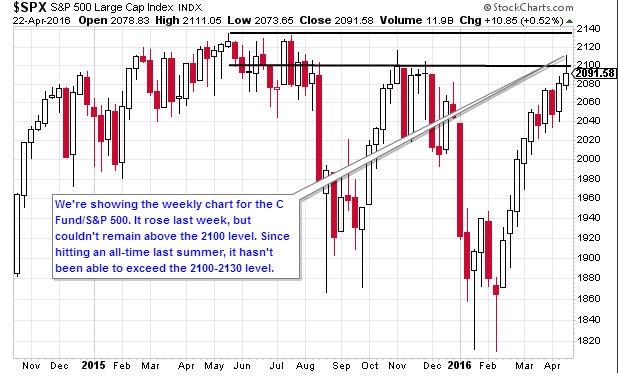
The stock market moved up last week. The S&P 500 touched the 2100 level for the first time since early December. Small-caps were the best performers, while tech stocks lagged the broader market.
Economic Data
Initial jobless claims fell to a 40+ year low. Existing home sales were also better-than-expected. On the negative side, US housing starts and housing permits were worse-than-expected.
TSP Funds
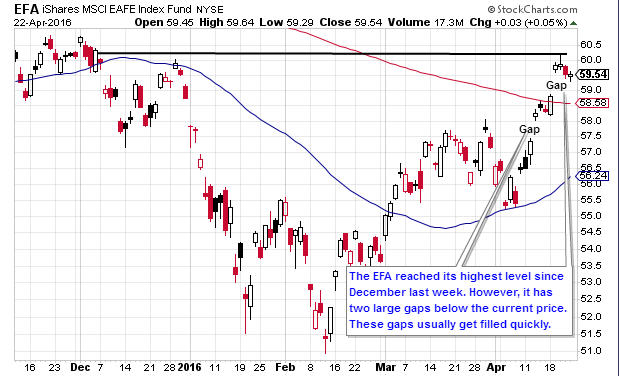
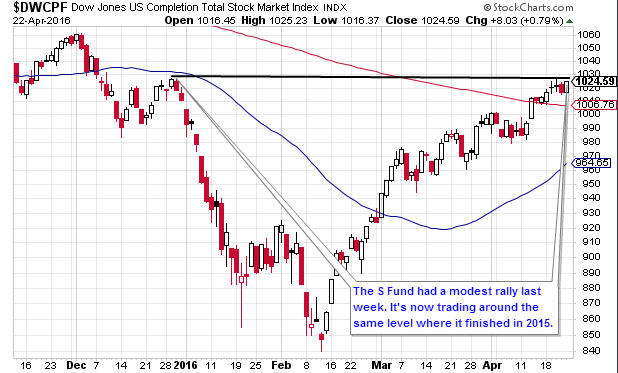
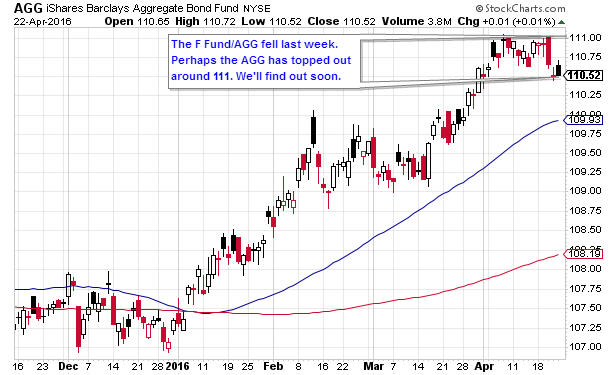
The I Fund had the biggest gain of 1.31%. The S Fund advanced by 1.22% and the C Fund had a gain of 0.53%. The F Fund had a loss of 0.41%.
Strategy Allocations
| Standard | 50 Day | BTD | LR |
|---|---|---|---|
| 100% C | 100% G | 100% G | 50% G & 50% C |
BTD = Buy the Dip
LR = Low Risk
New Trades: none
See description of strategies here
TSP Fund Performance (4/22/2016 YTD)
| G Fund | F Fund | C Fund | S Fund | I Fund |
|---|---|---|---|---|
| 0.59% | 3.13% | 3.05% | 2.11% | 1.08% |
Strategy Performance (4/22/2016 YTD)
| Standard | 50 Day | BTD | LR |
|---|---|---|---|
| -3.95% | 2.28% | 0.59% | -0.79% |
Charts
1. Daily S&P 500 (C Fund Proxy)
2. Daily EFA (I Fund Proxy)
3. Daily Wilshire 4500 (S Fund Proxy)
4. Daily AGG (F Fund Proxy)
Get The Full Picture
Weekly Wrap Up
From Briefing.com