Quick Recap of the Week
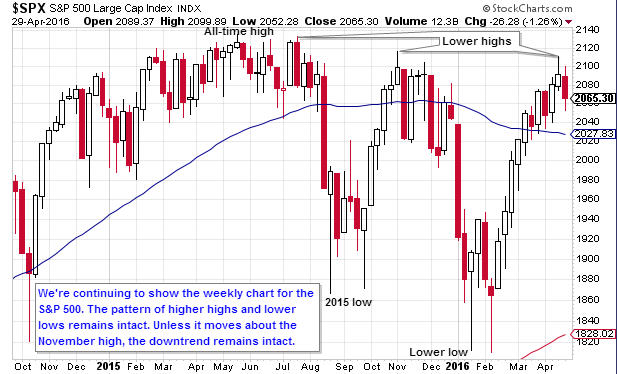
Stocks fell last week. Once again, 2100 acted as a ceiling for the S&P 500. After falling to almost 2050 on Friday, the S&P 500 had a modest bounce, however.
Economic Data
Initial jobless claims and the Richmond manufacturing survey were better-than-expected. On the negative side, durable goods, consumer confidence and the U.S. economy’s gross domestic product came in below expectations.
TSP Funds
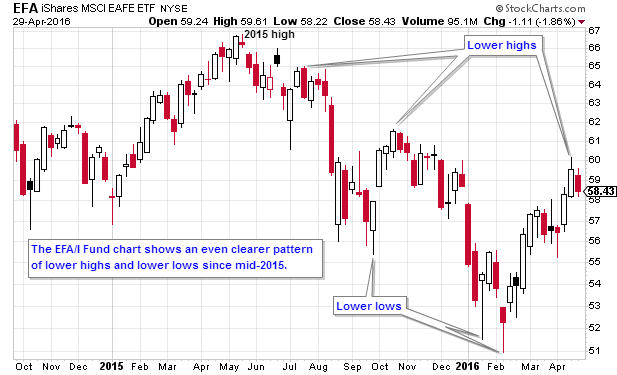
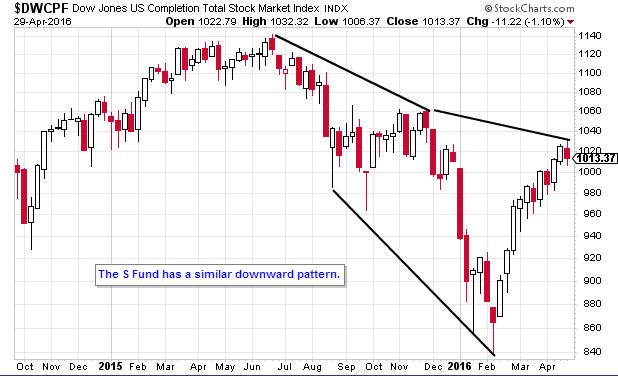
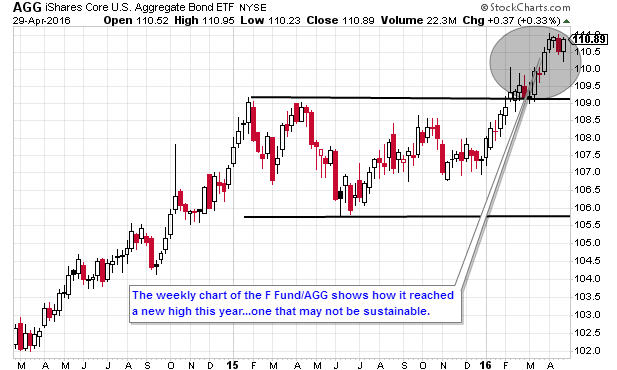
The I Fund had the biggest loss of 1.46%. The C Fund fell 1.24%, while the S Fund dropped by 1.07%. The F Fund rose by 0.41%.
Strategy Allocations
| Standard | 50 Day | BTD | LR |
|---|---|---|---|
| 50% G & 50% C* | 100% G | 100% C* | 75% G & 25% C* |
BTD = Buy the Dip
LR = Low Risk
New Trades: Standard, BTD and LR have new interfund transfers as of 4/29/16. Please make IFTs before noon EST on 5/2/16.
See description of strategies here
TSP Fund Performance (4/29/2016 YTD)
| G Fund | F Fund | C Fund | S Fund | I Fund |
|---|---|---|---|---|
| 0.63% | 3.55% | 1.77% | 1.02% | -0.39% |
Strategy Performance (4/29/2016 YTD)
| Standard | 50 Day | BTD | LR |
|---|---|---|---|
| -5.14% | 2.32 | 0.63% | -1.38% |
Charts
1. Daily S&P 500 (C Fund Proxy)
2. Daily EFA (I Fund Proxy)
3. Daily Wilshire 4500 (S Fund Proxy)
4. Daily AGG (F Fund Proxy)
Get The Full Picture
Weekly Wrap Up
From Briefing.com