Recap of the Week
Stocks moved up for the third straight week. The S&P 500 reached an all-time high for the first time since May 2015. Second-quarter corporate earnings reports began last week. This was the main driver of stock prices.
Economic Data
Retail sales, jobless claims and industrial production came in better-than-expected. Consumer sentiment came in below its forecast, however.
TSP Funds
The I Fund led the way with a 3.01% gain. It was followed by the S Fund’s 1.86% rise and the C Fund’s 1.51% gain. The F Fund fell by 0.77%.
Strategy Allocations
| Standard | 50 Day | BTD | LR |
|---|---|---|---|
| 50% G & 50% C | 100% G | 100% C | 75% G & 25% C |
BTD = Buy the Dip
LR = Low Risk
New Trades: None
See description of strategies here
TSP Fund Performance (7/15/2016 YTD)
| G Fund | F Fund | C Fund | S Fund | I Fund |
|---|---|---|---|---|
| 0.99% | 5.53% | 7.07% | 6.67% | -0.89% |
Strategy Performance (7/15/2016 YTD)
| Standard | 50 Day | BTD | LR |
|---|---|---|---|
| -2.27% | 8.31% | 5.06% | 0.30% |
Charts
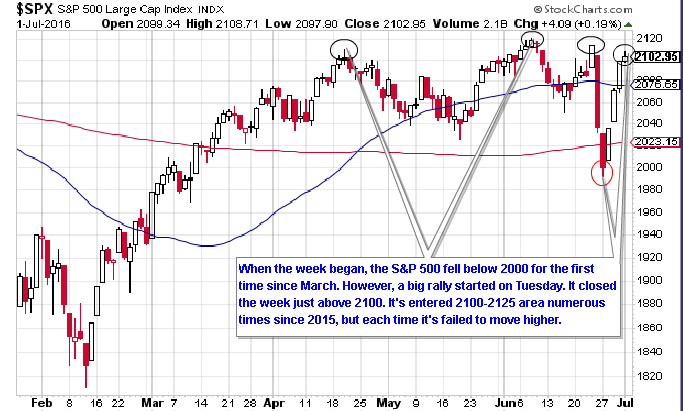
1. Daily S&P 500 (C Fund Proxy)
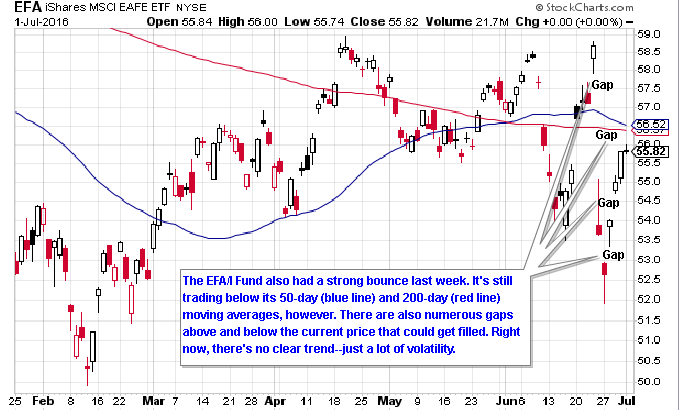
2. Daily EFA (I Fund Proxy)
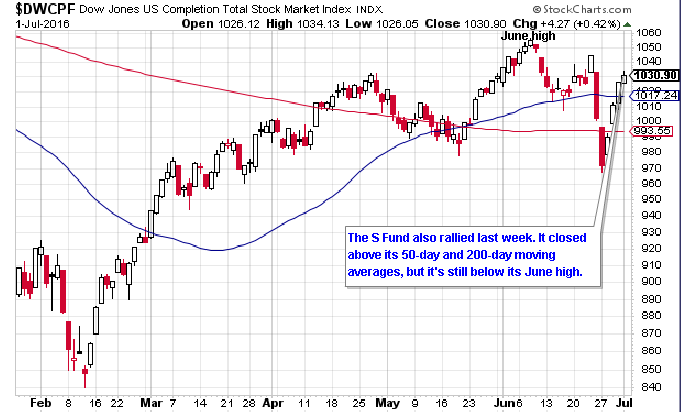
3. Daily Wilshire 4500 (S Fund Proxy)
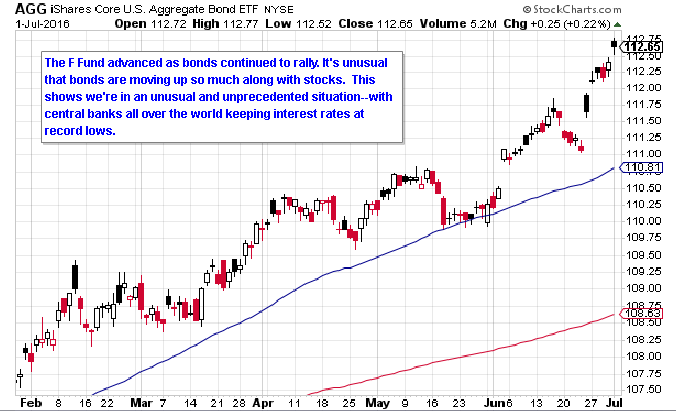
4. Daily AGG (F Fund Proxy)
Get The Full Picture
Weekly Wrap Up
From Briefing.com