Tag Archives: Thrift Savings Plan

2019 in Review

2019 was a banner year for the stock market. The TSP stock funds had gains of 22.47% (I Fund), 27.97% (S Fund) and 31.45% (C Fund).

TSPKey’s performance

It was a good year for our service. Our 28.31% return was higher than 9 of the 10 TSP funds, including all of the L Funds.

We also outperformed the 6 other professional services tracked by TSPCenter (based on their 1-year returns as of 12/31/2019) and TSPTalk’s advisory services.

A better comparison

A 100% stock fund allocation isn’t the best “apples to apples” comparison for our service. We weren’t fully invested in stock funds all of last year. Our average daily allocation was 81% in stock funds. The rest was split between the G and F Funds.

The L 2050 Fund is a better benchmark. It’s invested 81.75% in stock funds, almost identical to ours. The L 2050 had a 23.33% gain last year, so our return was decidedly higher.

Let’s assume someone was really lucky and guessed the C Fund would be 2019’s top performer. If they invested 81% in C and split the rest between the F and G Funds, the return would be 26.23%, still lower than ours at the same risk level.

Lessons learned

There are a few major takeaways from 2019:

Lesson 1: Don’t fight the trend

“The trend is your friend” is an old Wall Street adage, and the trend for stocks was up in 2019. If you kept a large allocation in the G and F Funds, you missed a great opportunity.

Lesson 2: Don’t fear the bear

Despite the stock rally, there was no shortage of scary news. Gloomy headlines about trade wars, international tensions and impeachment were everywhere. Many analysts–including some TSP services–predicted a recession or market crash. If you followed their advice and moved out of stocks, you also missed out.

Lesson 3: Make decisions based on data, not emotions

Is there ever a time to reduce your stock allocation? Yes, but only when you use clear, tested rules and hard data–not headlines and gloomy predictions. Our system uses three criteria:

  • The stock market’s long-term trend
  • An economic data index (manufacturing, housing, employment, yield curve, etc.). If the long-term trend turns down, is it temporary or is a real recession on the horizon? This index keeps us in stocks during short-term disruptions when the economy is still sound. It’s better to hold some stock funds unless a true, long-term bear market happens.
  • Seasonality. Historically the stock market performs better during certain times of the year.

These are binary (yes or no) indicators telling us to invest fully, partially or not at all in stock funds. They remove emotions and biases.

Right now the market’s long-term trend is up. Our economic data index is positive, though it’s weakened a bit recently.

Wrapping Up

Whether you use our service or not, we hope this will help optimize your TSP account and other investments. In summary:

  • Keep a higher allocation of stock funds when the market is trending up
  • Don’t change your investing plan based on news, hype or fear
  • Use rule-based systems and principles to manage your investments

Join us!

Need help allocating your TSP funds? Become a TSPKey member here. You’ll get our TSP specific fund recommendations and weekly newsletter.

TSPKey does not give personalized investment advice. This is for informational and educational purposes only. Past and/or hypothetical performance is not an indication of future performance.
Newsletter 1/2/15

Quick Recap of the Week

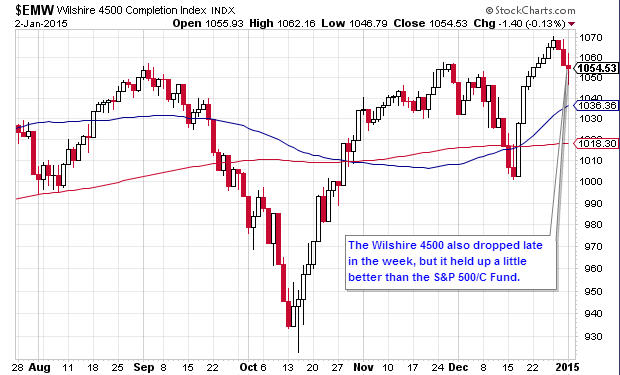
Stocks fell during another holiday-shortened week. As expected, both news and trading volume were light. Political uncertainty in Greece dragged down European stocks, however. As a result, the I Fund had the week’s largest loss of 1.54%.

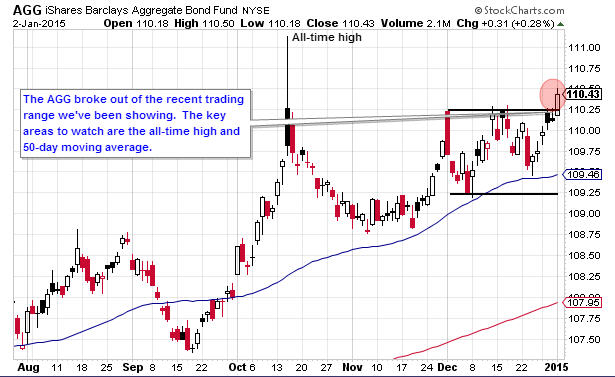
The C Fund wasn’t far behind, falling 1.42%. The S Fund fell 1.04%, while the F Fund gained 0.62%.

  • YTD Return as of 1/2/15: -0.18%
  • Current allocation: 100% S Fund as of 12/29/14
  • New Trades: None.

TSP Fund Performance (1/2/2015 YTD)

G Fund F Fund C Fund S Fund I Fund
0.01% 0.18% -0.02% -0.18% 0.00%

Charts

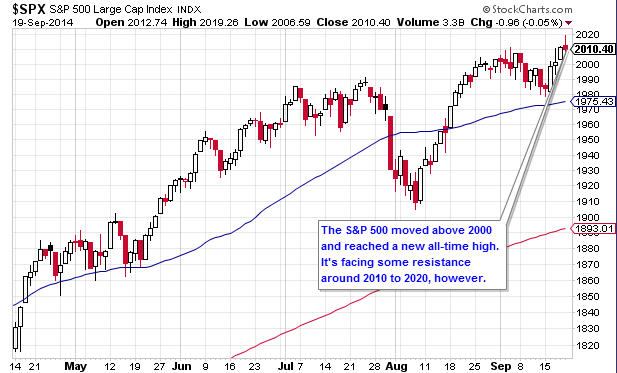
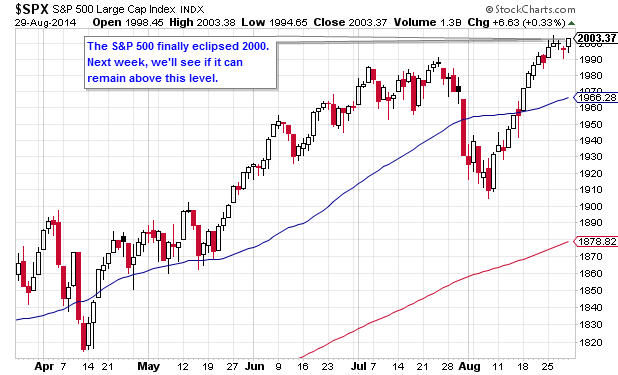
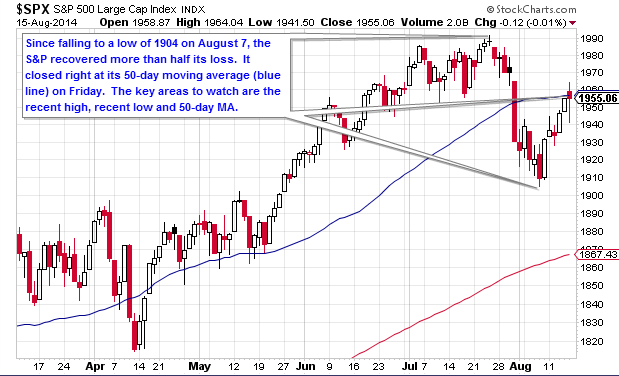
1.  Daily S&P 500 (C Fund Proxy)

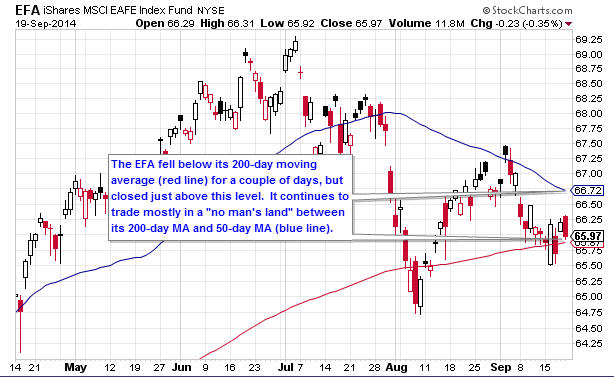
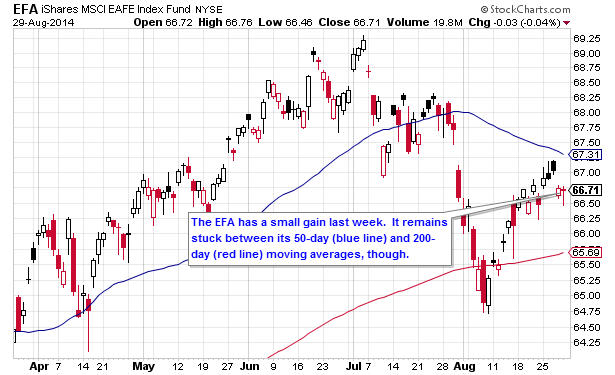
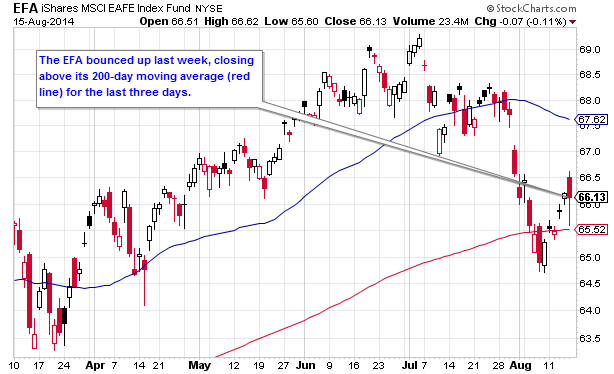
2.  Daily EFA (I Fund Proxy)

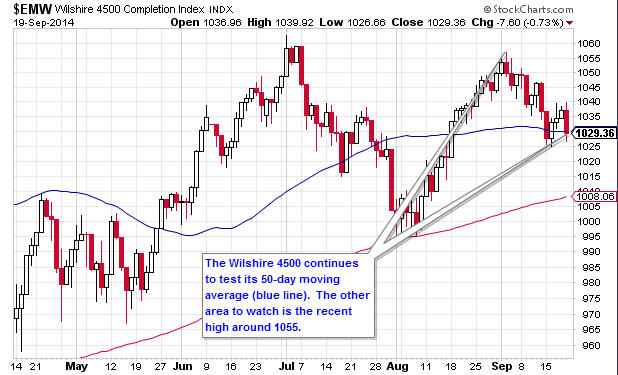
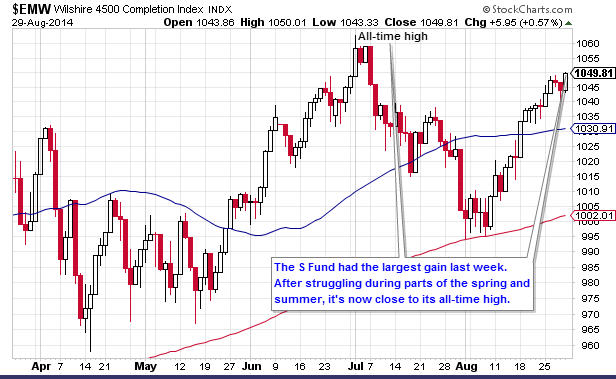
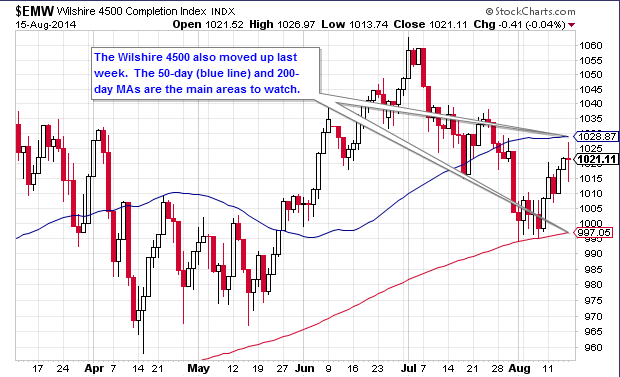
3.  Daily Wilshire 4500 (S Fund Proxy)

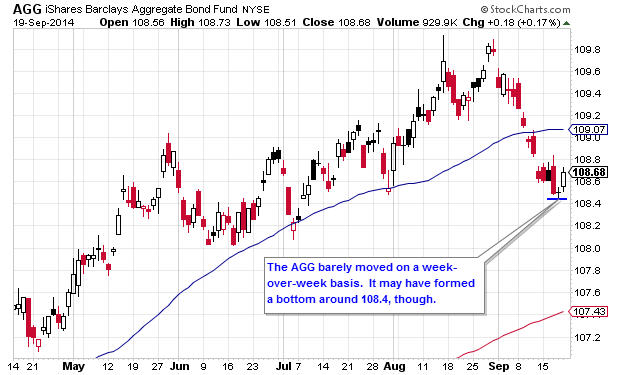
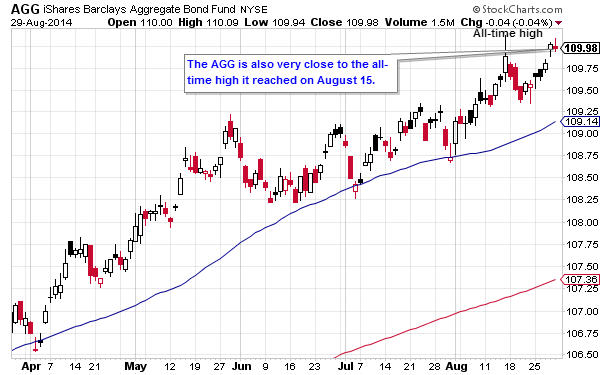
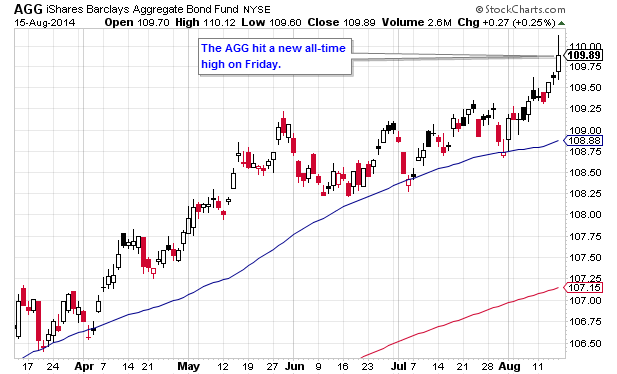
4.  Daily AGG (F Fund Proxy)

Get The Full Picture

Weekly Wrap Up

From Briefing.com

Newsletter 11/14/14

Quick Recap of the Week

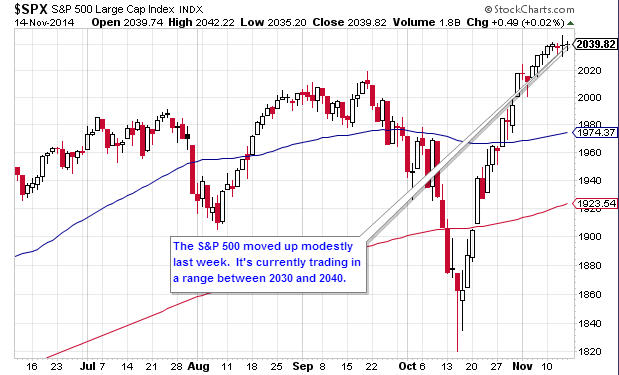
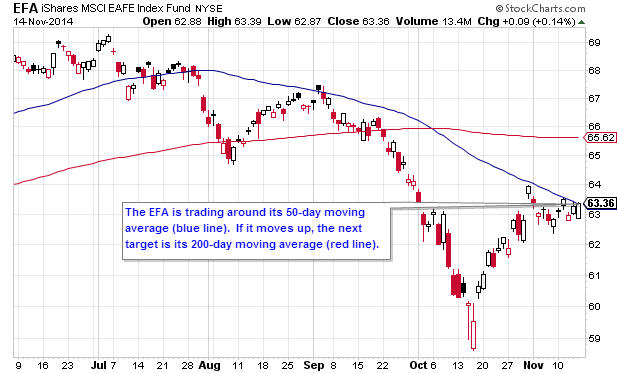
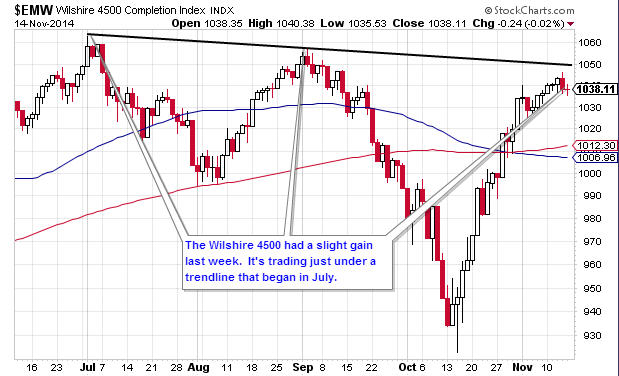
Last week, stocks moved up slightly in a quiet week of trading. There were a few important economic data items, like Retail Sales and Consumer Sentiment. However, their better-than-expected results had little impact on the markets.

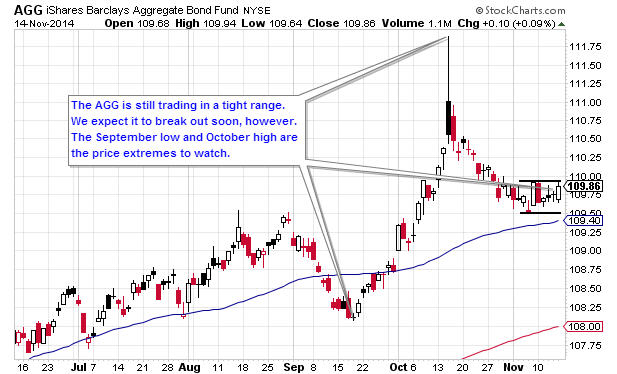
The I Fund had the best return, gaining 0.87%. Following it were the C Fund with a 0.45% increase and the S Fund, which advanced 0.27%. The F Fund was flat, moving up a negligible 0.01%.

  • YTD Return as of 11/14/14: 1.06%
  • Current allocation: 100% C Fund as of 11/3/14
  • New Trades: None

TSP Fund Performance (11/14/2014 YTD)

G Fund F Fund C Fund S Fund I Fund
2.04% 5.83% 12.43% 5.88% -2.65%

Charts

1.  Daily S&P 500 (C Fund Proxy)

2.  Daily EFA (I Fund Proxy)

3.  Daily Wilshire 4500 (S Fund Proxy)

4.  Daily AGG (F Fund Proxy)

Get The Full Picture

Weekly Wrap Up

From Briefing.com

Newsletter 9/26/14

Quick Recap of the Week

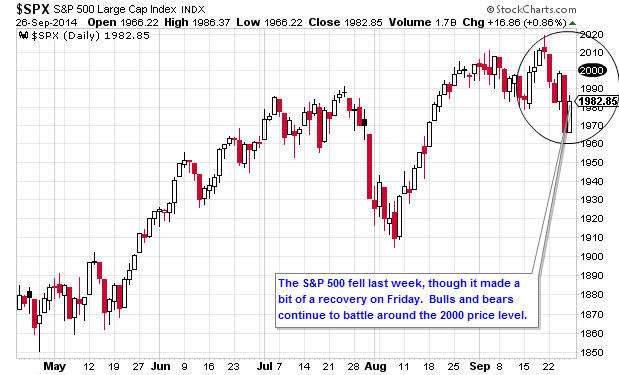
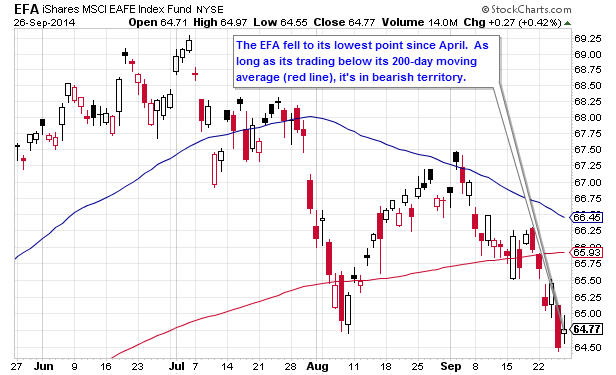
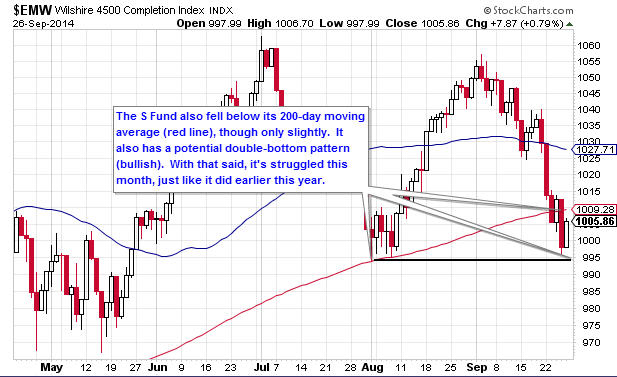
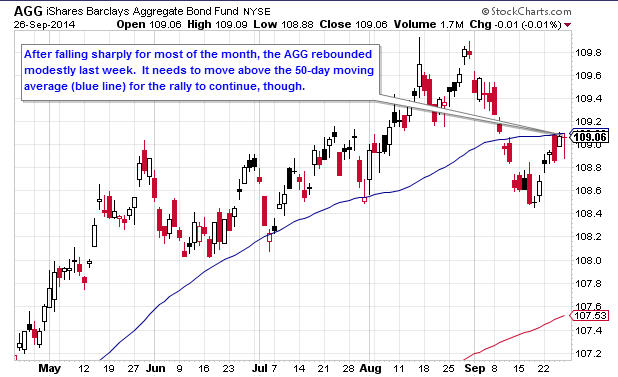
The stock market fell last week.  There wasn’t much economic data in the U.S.  However, comments from officials in China and Japan pushed stocks lower early in the week.  The S and I Funds were hit the hardest, falling 2.49% and 2.20%, respectively.  The C dropped by 1.34%, while the F Fund rebounded with a 0.23% gain.

  • YTD Return as of 9/26/14: 2.35%
  • Current allocation: 100% S Fund as of 9/2/14
  • New Trades: None

TSP Fund Performance (9/26/2014 YTD)

G Fund F Fund C Fund S Fund I Fund
1.72% 4.61% 8.97% 2.43% -0.53%

Charts

1.  Daily S&P 500 (C Fund Proxy)

2.  Daily EFA (I Fund Proxy)

3.  Daily Wilshire 4500 (S Fund Proxy)

4.  Daily AGG (F Fund Proxy)

Get The Full Picture

Weekly Wrap Up

From Briefing.com

Newsletter 9/19/14

Quick Recap of the Week

The stock market ended the week with mixed results. Investors favored large-cap stocks, but shunned small-caps and other risky equities. The biggest news item was the Federal Reserve’s statement on Wednesday. The Fed left rates at all-time lows, but reduced its bond purchases.

The C Fund ended the week 1.27% higher, while the I Fund remained flat with a 0.04% gain. The S Fund fell 0.67%, while the F Fund gained 0.18%.

  • YTD Return as of 9/19/14: 4.70%
  • Current allocation: 100% S Fund as of 9/2/14
  • New Trades: None

TSP Fund Performance (9/19/2014 YTD)

G Fund F Fund C Fund S Fund I Fund
1.68% 4.38% 10.45% 4.78% 1.70%

Charts

1.  Daily S&P 500 (C Fund Proxy)

2.  Daily EFA (I Fund Proxy)

3.  Daily Wilshire 4500 (S Fund Proxy)

4.  Daily AGG (F Fund Proxy)

Get The Full Picture

Weekly Wrap Up

From Briefing.com

Newsletter 9/12/14

Quick Recap of the Week

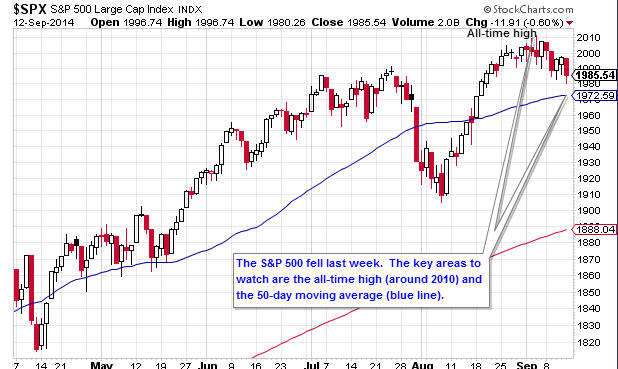
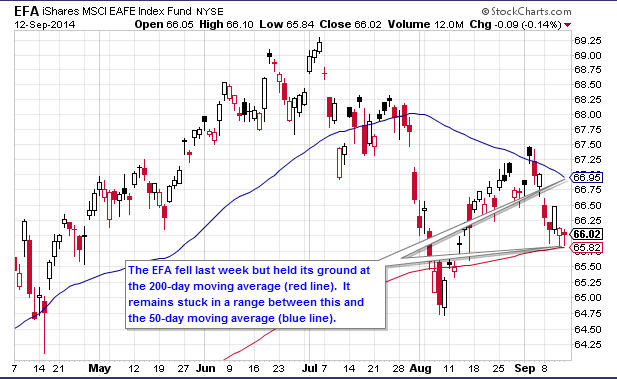
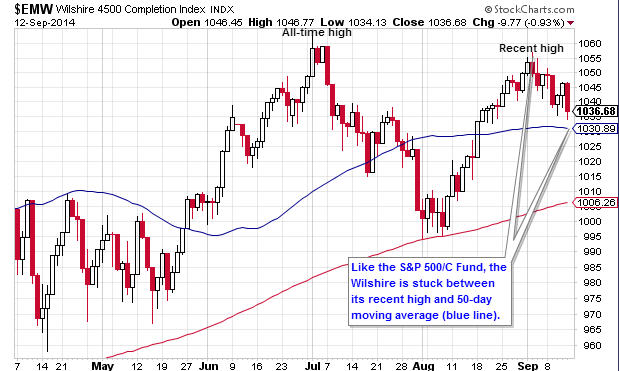
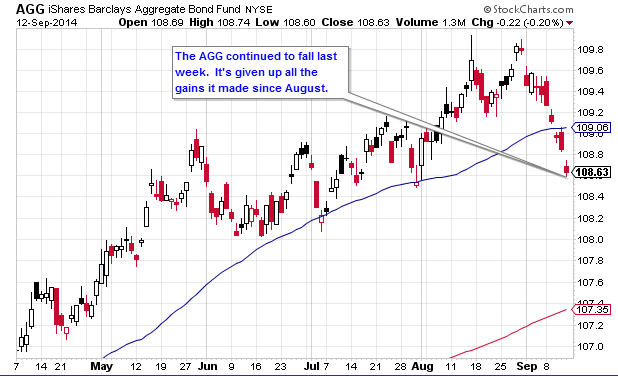
Both stocks and bonds fell last week. Weakness in the energy sector caused the broader markets to fall.  The TSP stock funds fell by similar amounts.  The I Fund declined 1.30%, while the C fell 1.05% and the S dropped by 1.00%.  The F Fund moved down 0.65%.

  • YTD Return as of 9/12/14: 5.41%
  • Current allocation: 100% S Fund as of 9/2/14
  • New Trades: None

TSP Fund Performance (9/12/2014 YTD)

G Fund F Fund C Fund S Fund I Fund
1.64% 4.18% 9.06% 5.49% 1.66%

Charts

1.  Daily S&P 500 (C Fund Proxy)

2.  Daily EFA (I Fund Proxy)

3.  Daily Wilshire 4500 (S Fund Proxy)

4.  Daily AGG (F Fund Proxy)

Get The Full Picture

Weekly Wrap Up

From Briefing.com

Newsletter 9/05/14

Quick Recap of the Week

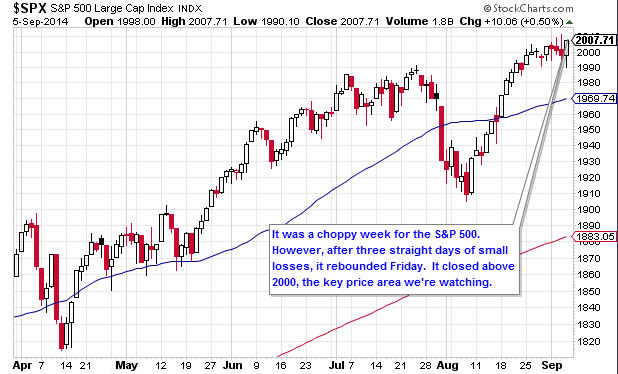
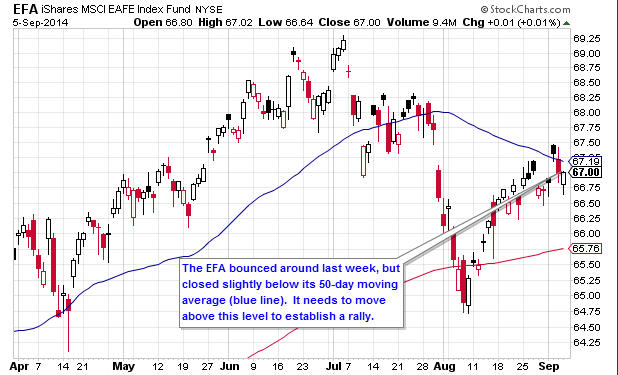
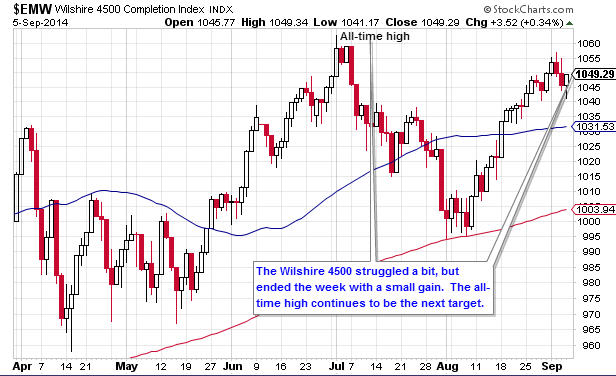
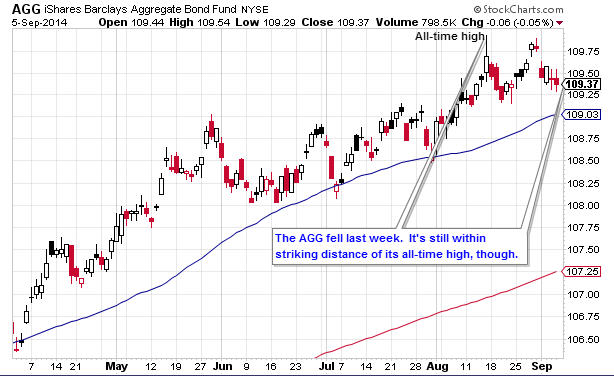
The holiday-shortened week was choppy and indecisive for the stock market. Most economic data was favorable. However, Friday’s employment report was worse-than-expected. The TSP funds had mixed results.  The C and I Funds moved up by 0.25 and 0.13%, respectively. The S Fund declined 0.06% while the F Fund fell by 0.45%.

  • YTD Return as of 9/5/14: 6.47%
  • Current allocation: 100% S Fund as of 9/2/14
  • New Trades: None

TSP Fund Performance (9/5/2014 YTD)

G Fund F Fund C Fund S Fund I Fund
1.60% 4.86% 10.22% 6.55% 3.00%

Charts

1.  Daily S&P 500 (C Fund Proxy)

2.  Daily EFA (I Fund Proxy)

3.  Daily Wilshire 4500 (S Fund Proxy)

4.  Daily AGG (F Fund Proxy)

Get The Full Picture

Weekly Wrap Up

From Briefing.com

Newsletter 8/29/14

Quick Recap of the Week

Stocks closed on Friday with a gain for the week and for the month.  There wasn’t much market-related news. The biggest item was the Chicago Purchasing Manager’s Index, which was better than expected. The S Fund led the TSP, advancing 1.12%. Following it were the C Fund with a 0.80% gain and the I Fund, which moved up 0.62%. The F Fund rose by 0.38% as bonds had another strong week.

  • YTD Return as of 8/29/14: 6.97%
  • Current allocation: 100% S Fund as of 9/2/14
  • New Trades: IFT and new Contribution Allocation to 100% S Fund before noon EST on Tuesday, 9/2/14.

TSP Fund Performance (8/29/2014 YTD)

G Fund F Fund C Fund S Fund I Fund
1.57% 5.34% 9.94% 6.62% 2.86%

Charts

1.  Daily S&P 500 (C Fund Proxy)

2.  Daily EFA (I Fund Proxy)

3.  Daily Wilshire 4500 (S Fund Proxy)

4.  Daily AGG (F Fund Proxy)

Get The Full Picture

Weekly Wrap Up

From Briefing.com

Newsletter 8/15/14

Quick Recap of the Week

The stock market moved up again last week.  The S Fund led the way with a 1.40% gain.  The C and I Funds were close behind, with gains of 1.29% and 1.16%, respectively.  The F Fund increased by 0.45%.  There was no clear catalyst for the rally.  Economic data releases had mixed results.  Most likely, the rally was a continuing technical bounce after the recent pullback.

  • YTD Return as of 8/15/14: 4.29%
  • Current allocation: 100% C Fund as of 6/20/14
  • New Trades: None

TSP Fund Performance (8/15/2014 YTD)

G Fund F Fund C Fund S Fund I Fund
1.46% 5.16% 7.19% 3.55% 1.45%

Charts

1.  Daily S&P 500 (C Fund Proxy)

2.  Daily EFA (I Fund Proxy)

3.  Daily Wilshire 4500 (S Fund Proxy)

4.  Daily AGG (F Fund Proxy)

Get The Full Picture

Weekly Wrap Up

From Briefing.com

Newsletter 8/8/14

Quick Recap of the Week

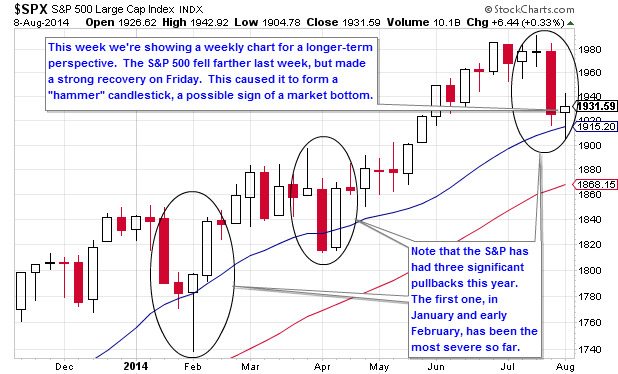
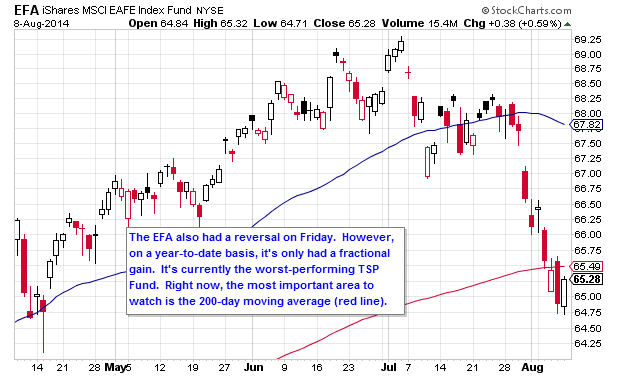
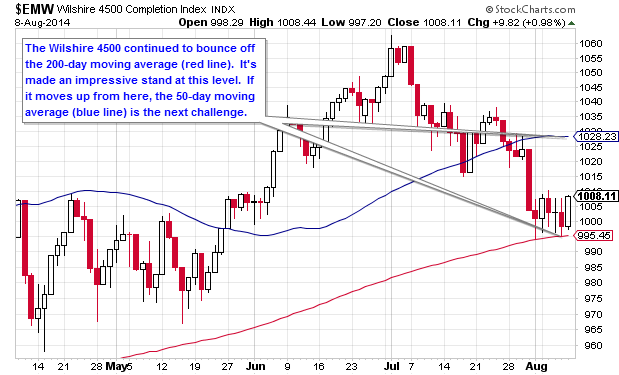
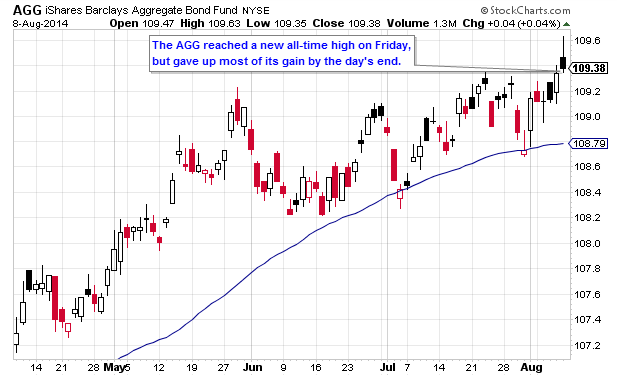
Thanks to a large rally on Friday, the U.S. stock market finished last week with a gain.  The S Fund was the top TSP performer with a 0.8% increase.  The C Fund moved up 0.4%, followed by the F Fund with a 0.29% gain.  The I Fund lost ground, falling by 1.92%.

  • YTD Return as of 8/8/14: 2.97%
  • Current allocation: 100% C Fund as of 6/20/14
  • New Trades: None

TSP Fund Performance (8/8/2014 YTD)

G Fund F Fund C Fund S Fund I Fund
1.42% 4.69% 5.83% 2.13% 0.28%

Charts

1.  Daily S&P 500 (C Fund Proxy)

2.  Daily EFA (I Fund Proxy)

3.  Daily Wilshire 4500 (S Fund Proxy)

4.  Daily AGG (F Fund Proxy)

Get The Full Picture

Weekly Wrap Up

From Briefing.com