Tag Archives: TSP Funds

Newsletter 8/5/16

Recap of the Week
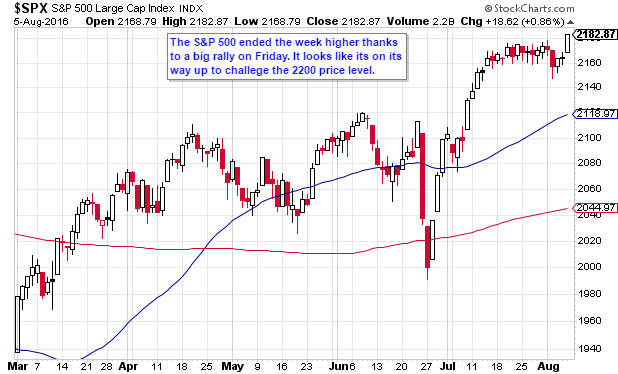
Stocks fell early last week. However, they ended the week with a gain thanks to a strong employment report on Friday.

Economic Data
As mentioned, the employment report was better-than-expected. On the negative side, initial jobless claims and the ISM services index were worse-than-expected.

TSP Funds
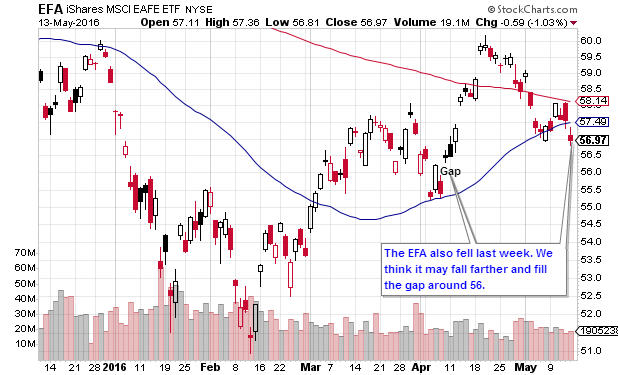
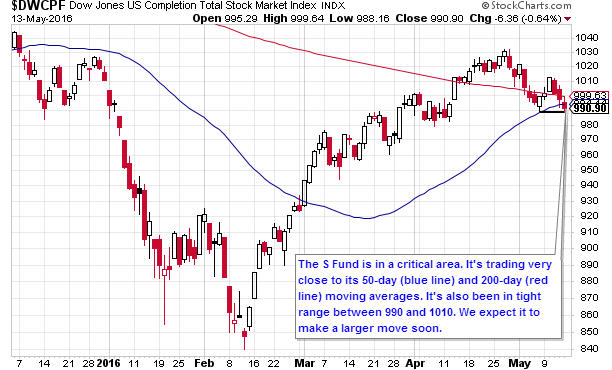
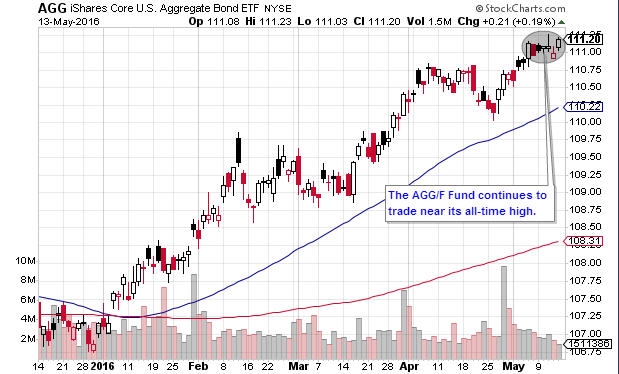
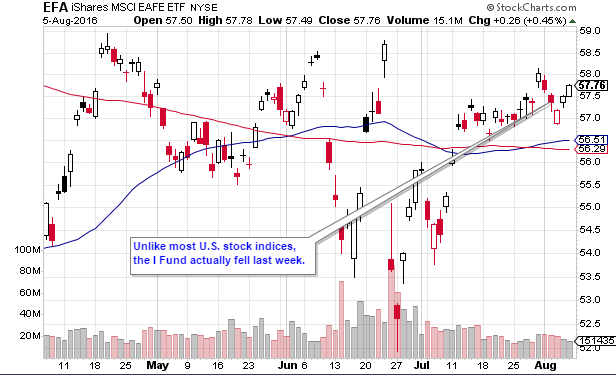
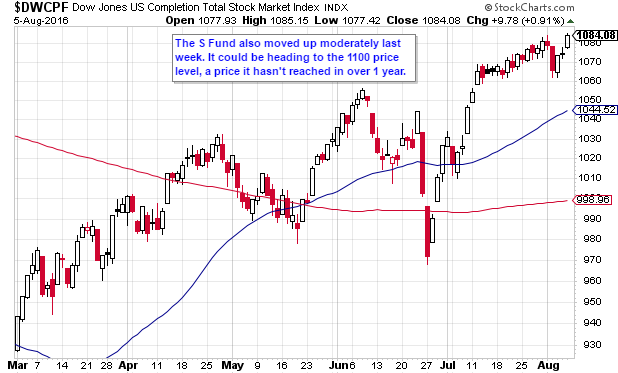
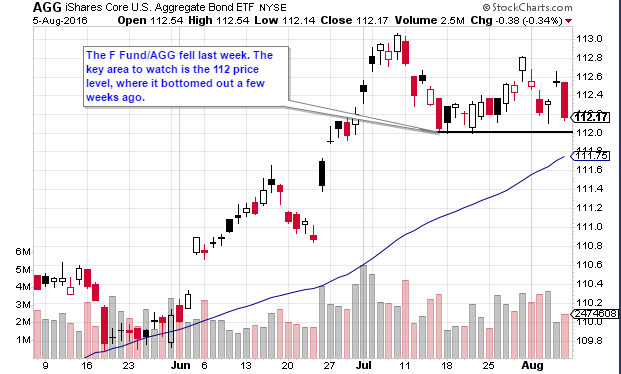
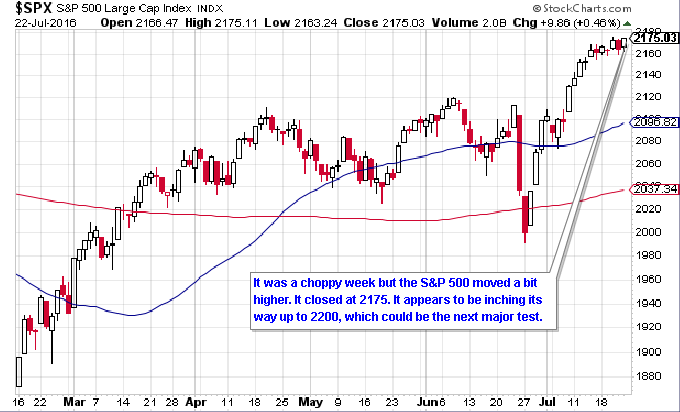
The C Fund moved up 0.49% while the S Fund gained 0.30%. The F Fund fell by 0.53% and the I Fund had a 1.35% loss.

Strategy Allocations

Standard  50 Day    BTD          LR
50% G & 50% S 100% G 100% G 75% G & 25% S


BTD = Buy the Dip
LR = Low Risk
New Trades: None.
See description of strategies here

TSP Fund Performance (8/5/16 YTD)

G Fund F Fund C Fund S Fund I Fund
1.08% 5.62% 8.22% 8.59% 0.09%


Strategy Performance (8/5/16 YTD)

Standard 50 Day  BTD   LR
-1.79% 8.41% 5.70% 0.59%

Charts
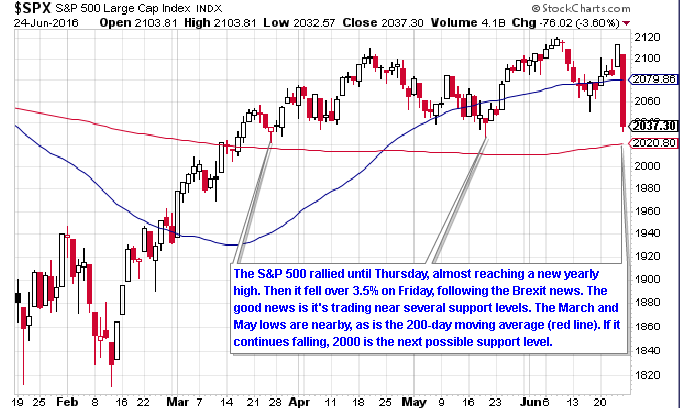
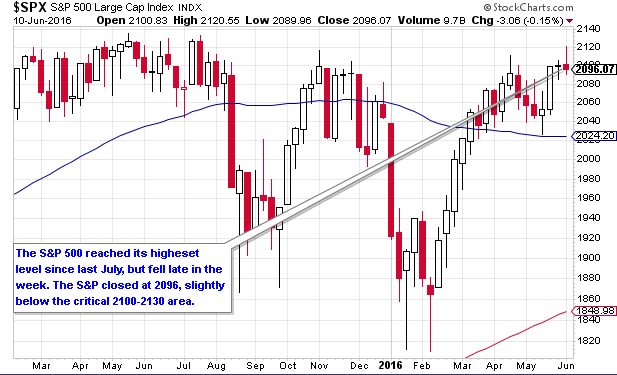
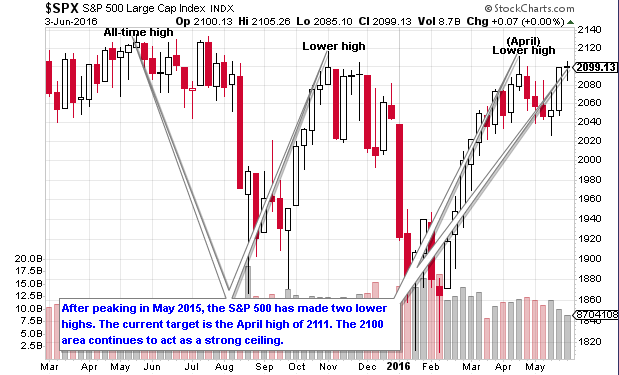
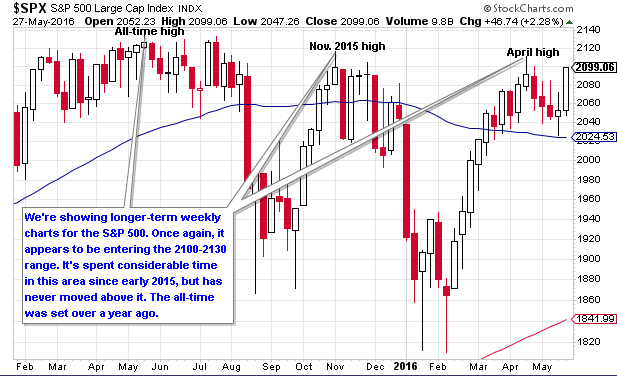
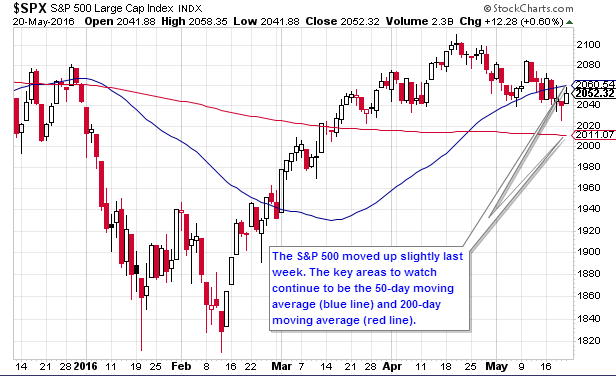
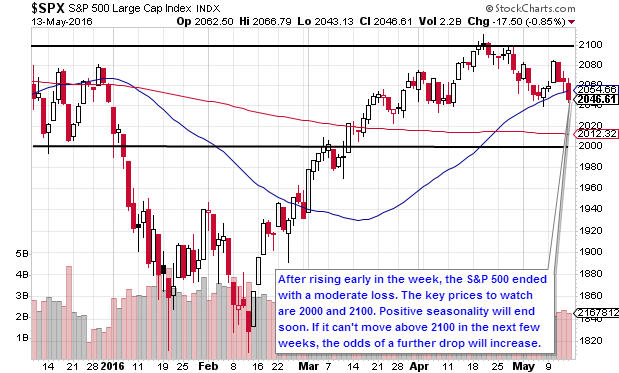
1.  Daily S&P 500 (C Fund Proxy)

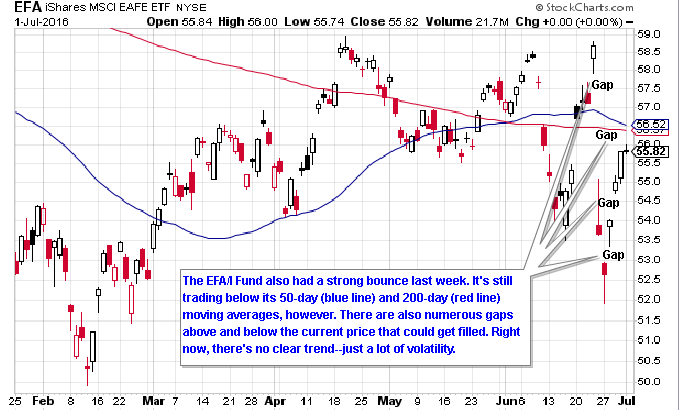
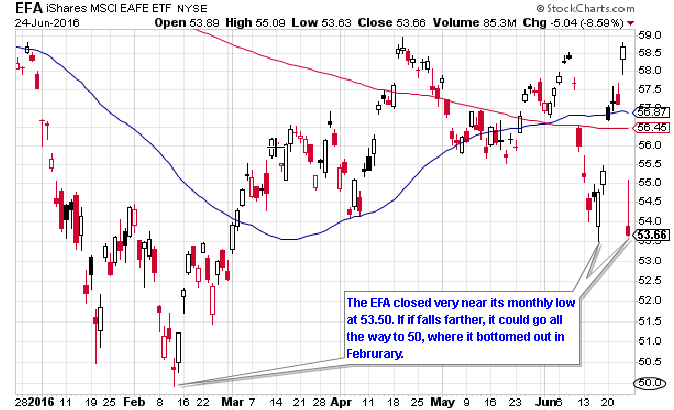
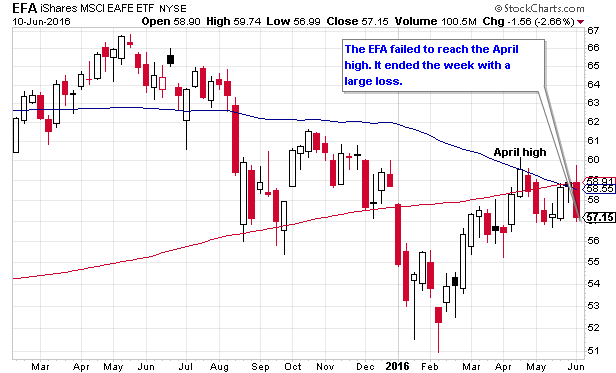
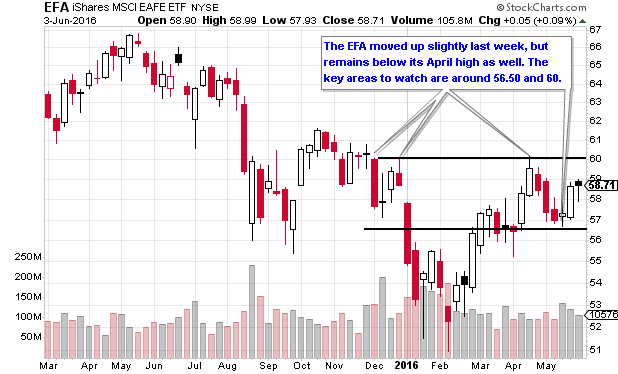
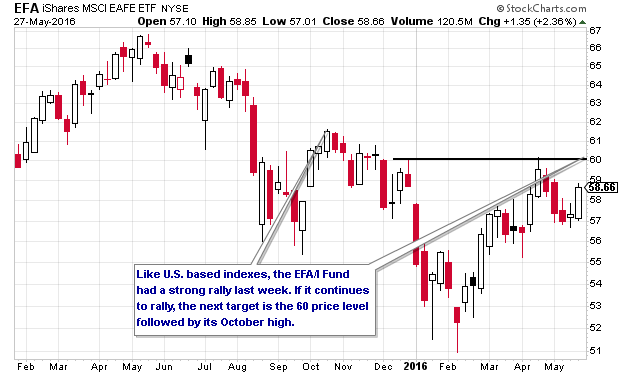
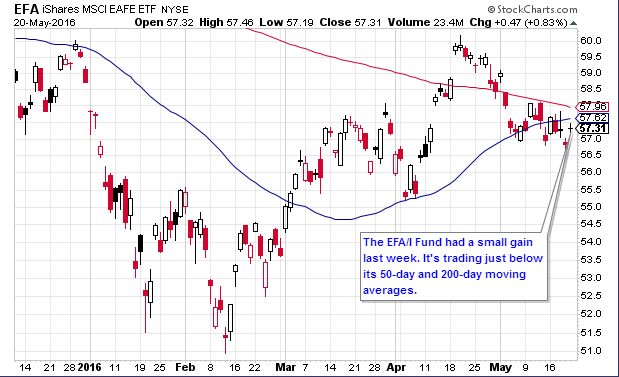
2.  Daily EFA (I Fund Proxy)

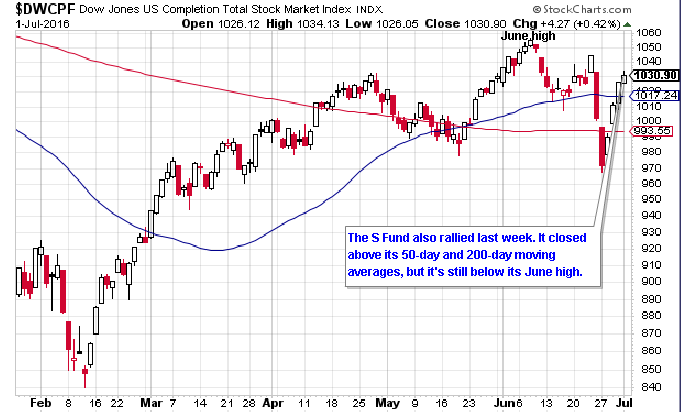
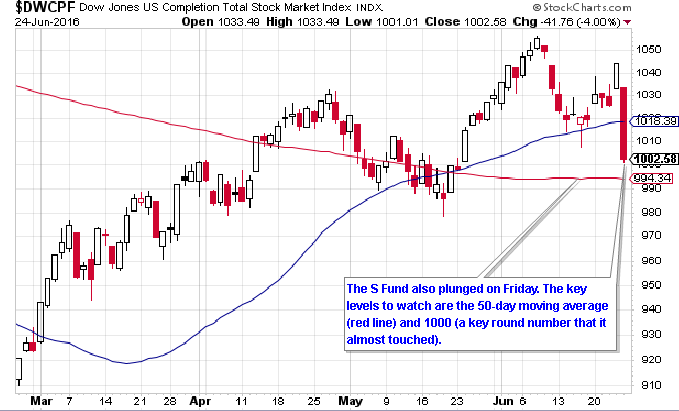
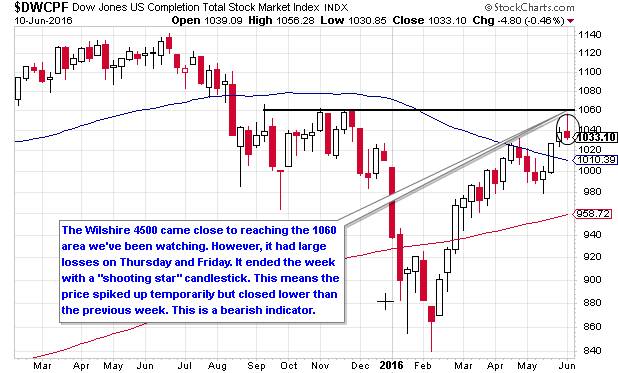
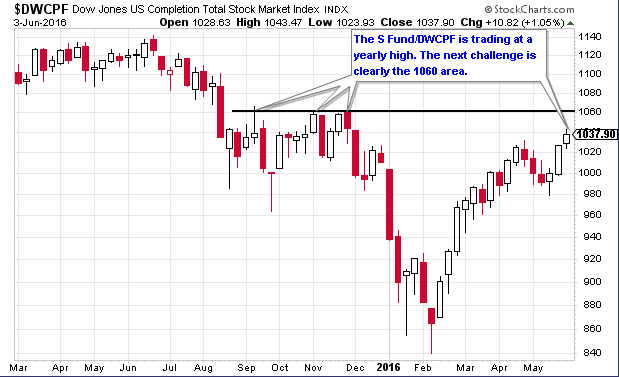
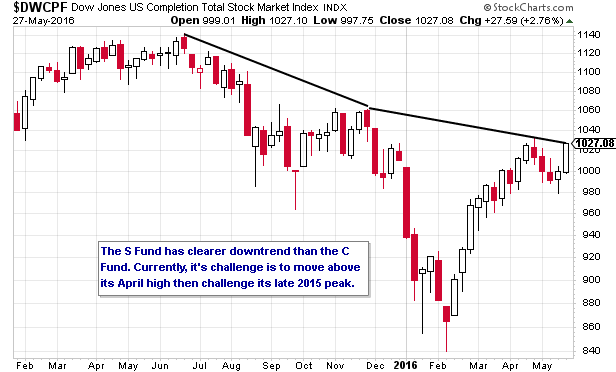
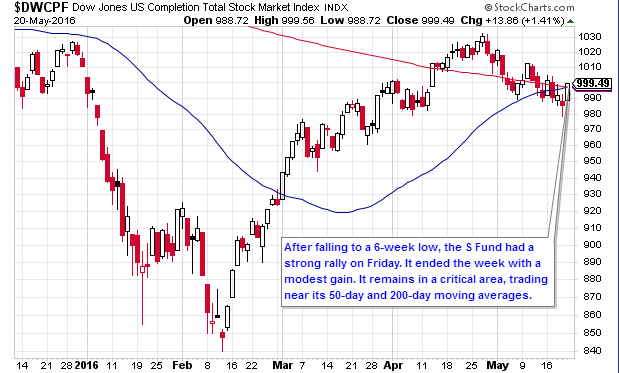
3.  Daily Wilshire 4500 (S Fund Proxy)

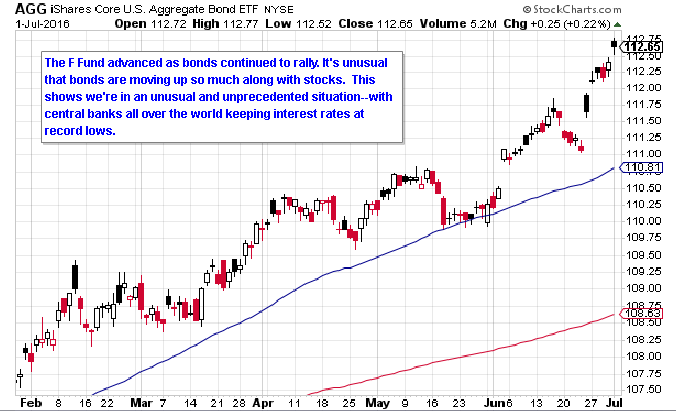
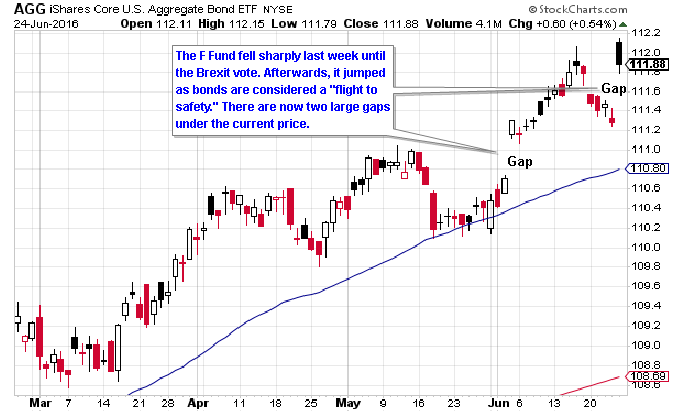
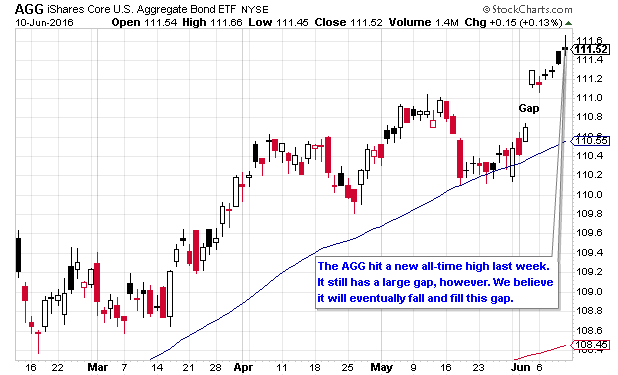
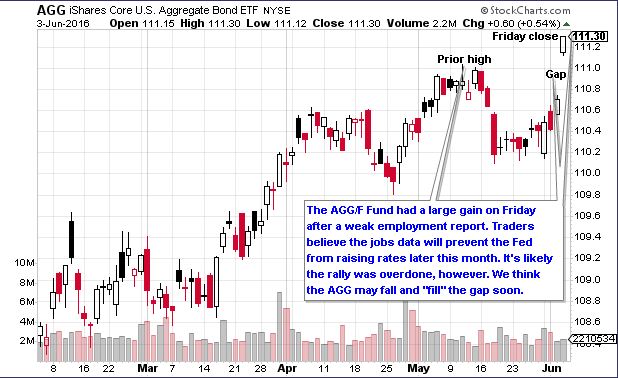
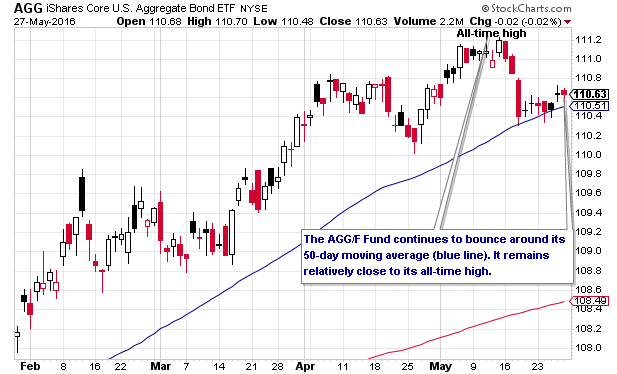
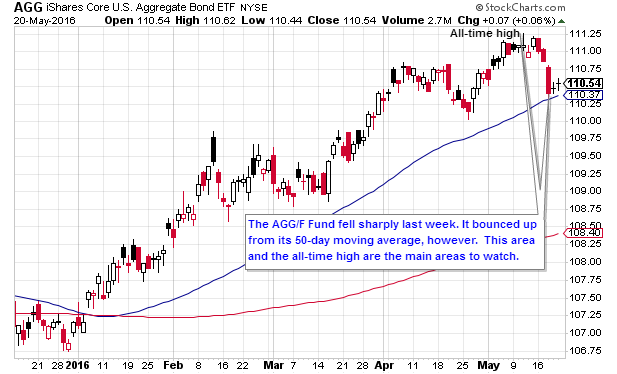
4.  Daily AGG (F Fund Proxy)

Get The Full Picture

Weekly Wrap Up

From Briefing.com
Newsletter 7/22/16 (Updated 7/28/16)

Recap of the Week
The stock market moved up once again. Trading was choppy and uneventful, however. The major indices had gains between 0.3% (Dow Jones) to 1.4% (Nasdaq). Corporate earnings continued to be the major driver of the markets.

Economic Data
Existing home sales, initial jobless claims and housing starts came in better-than-expected. On the negative side, the Philly Fed business outlook survey and Bloomberg consumer comfort index fell.

TSP Funds
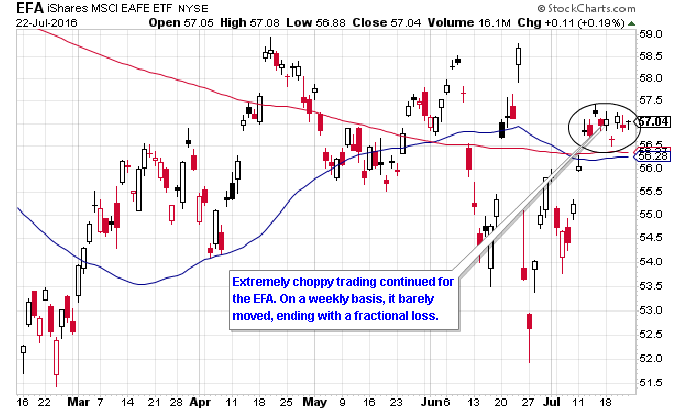
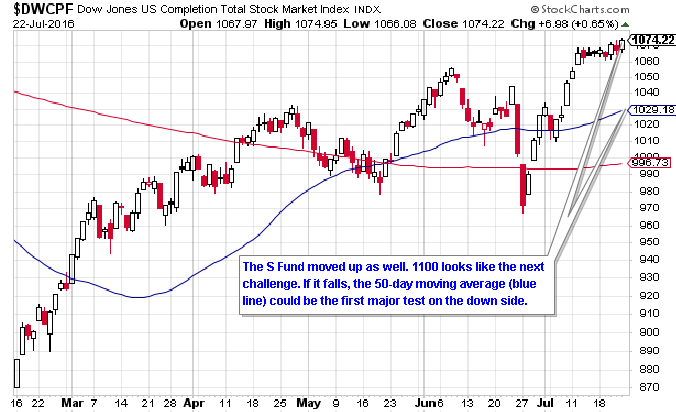
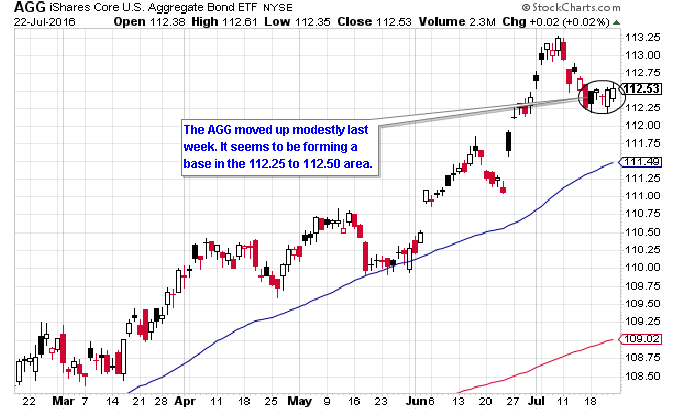
The S Fund moved up by 0.83%. The C Fund rose 0.64% while the F Fund gained 0.12%. The F Fund fell by a tiny fraction (0.01%).

Strategy Allocations

Standard  50 Day    BTD          LR
50% G & 50% S 100% G 100% G 75% G & 25% S


BTD = Buy the Dip
LR = Low Risk
New Trades: Interfund transfer and contribution allocation for Standard to 50% G and 50% S, BTD to 100% G and LR to 75% G and 25% S before noon EST on Friday, 7/29/16.
See description of strategies here

TSP Fund Performance (7/22/16 YTD)

G Fund F Fund C Fund S Fund I Fund
1.02% 5.66% 7.75% 7.55% -0.90%


Strategy Performance (7/22/16 YTD)

Standard 50 Day  BTD   LR
-1.94% 8.34% 5.73% 0.48%

Charts
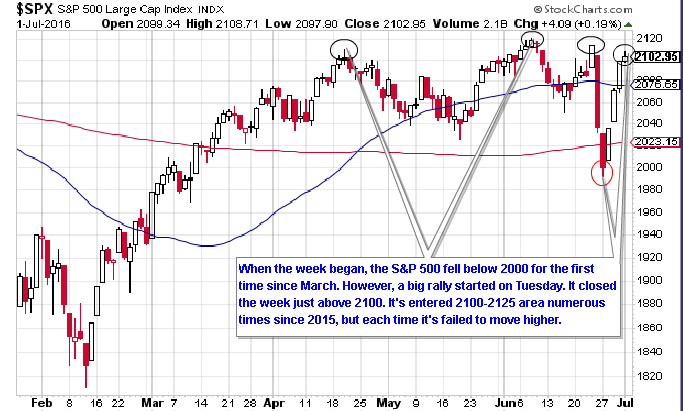
1.  Daily S&P 500 (C Fund Proxy)

2.  Daily EFA (I Fund Proxy)

3.  Daily Wilshire 4500 (S Fund Proxy)

4.  Daily AGG (F Fund Proxy)

Get The Full Picture

Weekly Wrap Up

From Briefing.com
Newsletter 7/16/16

Recap of the Week
Stocks moved up for the third straight week. The S&P 500 reached an all-time high for the first time since May 2015. Second-quarter corporate earnings reports began last week. This was the main driver of stock prices.

Economic Data
Retail sales, jobless claims and industrial production came in better-than-expected. Consumer sentiment came in below its forecast, however.

TSP Funds
The I Fund led the way with a 3.01% gain. It was followed by the S Fund’s 1.86% rise and the C Fund’s 1.51% gain. The F Fund fell by 0.77%.


Strategy Allocations

Standard  50 Day    BTD          LR
50% G & 50% C 100% G 100% C 75% G & 25% C


BTD = Buy the Dip
LR = Low Risk
New Trades: None
See description of strategies here

TSP Fund Performance (7/15/2016 YTD)

G Fund F Fund C Fund S Fund I Fund
0.99% 5.53% 7.07% 6.67% -0.89%


Strategy Performance (7/15/2016 YTD)

Standard 50 Day  BTD   LR
-2.27% 8.31% 5.06% 0.30%

Charts
1.  Daily S&P 500 (C Fund Proxy)

2.  Daily EFA (I Fund Proxy)

3.  Daily Wilshire 4500 (S Fund Proxy)

4.  Daily AGG (F Fund Proxy)

Get The Full Picture

Weekly Wrap Up

From Briefing.com
Newsletter 7/1/16 (Updated 7/5/16)

Quick Recap of the Week
When the markets opened last week, Brexit fears continued. Stocks fell Monday, giving the S&P 500 a two-day loss of 5%. After that, stocks bounced up sharply. The major indices ended the week with solid gains.

Economic Data
ISM manufacturing, the Case/Shiller home price index and consumer confidence all increased from the previous month. On the negative side, initial jobless claims and pending home sales were worse-than-expected.

TSP Funds
All of the TSP funds had gains. The I Fund rose by 1.68% while the C Fund gained 1.60%. The S Fund advanced by 1.22% while the F Fund gained 0.98%.

Strategy Allocations

Standard  50 Day    BTD          LR
50% G & 50% C 100% G* 100% C 75% G & 25% C


BTD = Buy the Dip
LR = Low Risk
*New Trades: Interfund transfer (IFT) for 50 Day to 100% G Fund before noon EST on Wednesday, 7/6/16.
See description of strategies here

TSP Fund Performance (7/1/2016 YTD)

G Fund F Fund C Fund S Fund I Fund
0.94% 5.72% 4.09% 3.14% -2.70%


Strategy Performance (7/1/2016 YTD)

Standard 50 Day  BTD   LR
-3.67% 8.39% 2.14% -0.45%

Charts
1.  Daily S&P 500 (C Fund Proxy)

2.  Daily EFA (I Fund Proxy)

3.  Daily Wilshire 4500 (S Fund Proxy)

4.  Daily AGG (F Fund Proxy)

Get The Full Picture

Weekly Wrap Up

From Briefing.com
Newsletter 6/24/16 (Updated 6/29/16)

Recap of the Week

The stock market had a roller coaster ride. It began with a mild rally early in the week. Then on Thursday, the final Brexit polls showed the “remain” voters with a lead. The rally accelerated and the S&P 500 closed near its yearly high.

However, the result of the vote shocked the market–and markets don’t like uncertainty or surprises. Global markets plummeted as gold and bonds soared. U.S. markets followed suit on Friday morning.

The major U.S. indices closed the week with losses between 1.5% and 2%.

Economic Data

Consumer sentiment, PMI manufacturing and jobless claims were better-than-expected. Durable goods orders and new home sales were worse-than-expected.

TSP Funds

The TSP stock funds had similar losses. The C fell by 1.62%, while the S Fund declined by 1.66%. The I Fund had a 1.71% loss. The F Fund advanced by 0.21%.

Strategy Allocations

Standard  50 Day    BTD          LR
50% G & 50% C* 100% C 100% C 75% G & 25% C*

* As of the market’s close on 6/30/16

BTD = Buy the Dip
LR = Low Risk
New Trades: Interfund transfer (IFT) and contribution allocation for Standard to 50% G Fund and 50% C Fund and for LR to 75% G Fund and 25% C Fund before noon EST on Thursday, 6/30/16.
See description of strategies here

TSP Fund Performance (6/24/2016 YTD)

G Fund F Fund C Fund S Fund I Fund
0.90% 4.91% 0.79% 0.20% -5.95%


Strategy Performance (6/24/2016 YTD)

Standard 50 Day  BTD   LR
-5.00% 3.04 -1.10% -1.16%

Charts
1.  Daily S&P 500 (C Fund Proxy)

2.  Daily EFA (I Fund Proxy)

3.  Daily Wilshire 4500 (S Fund Proxy)

4.  Daily AGG (F Fund Proxy)

Get The Full Picture

Weekly Wrap Up

From Briefing.com
Newsletter 6/10/16

Quick Recap of the Week
After a strong start, the stock market faltered last week. The Dow Jones was the only major index to end with a gain. The other indices suffered small losses.

Economic Data
On the positive side, weekly jobless claims fell while job openings rose. On the negative side, labor market conditions and nonfarm productivity fell.

TSP Funds
The F Fund advanced by 0.38%. All three stock funds fell. The C Fund had the smallest loss of 0.11%. The S Fund fell by 0.41%, while the I Fund was hammered by a 2.55% loss.

Strategy Allocations

Standard  50 Day    BTD          LR
50% G & 50% S 100% G 100% C 75% G & 25% S


BTD = Buy the Dip
LR = Low Risk
New Trades: None
See description of strategies here

TSP Fund Performance (6/10/2016 YTD)

G Fund F Fund C Fund S Fund I Fund
0.83% 4.63% 3.62% 3.21% -2.44%


Strategy Performance (6/10/2016 YTD)

Standard 50 Day  BTD   LR
-3.64% 2.97 1.67% -0.50%

Charts
1.  Daily S&P 500 (C Fund Proxy)

2.  Daily EFA (I Fund Proxy)

3.  Daily Wilshire 4500 (S Fund Proxy)

4.  Daily AGG (F Fund Proxy)

Get The Full Picture

Weekly Wrap Up

From Briefing.com
Newsletter 6/3/16

Quick Recap of the Week
Stocks had mixed results during the holiday-shortened week. The Dow fell while the S&P 500 and Nasdaq had very small gains. Small-cap stocks had a more significant rally.

Economic Data
ISM Manufacturing and factory orders were better-than-expected. Chicago PMI, consumer confidence, ISM Services and construction spending came in below their forecasts.

The big news was employment data on Friday. Nonfarm payrolls were far below their expected number. The poor data caused bonds and gold to spike, while the major stock indices fell. They recovered most of their losses by the end of the day, however.

Based on the employment numbers, the odds of either a June or July Fed rate hike fell sharply.

TSP Funds
The S Fund had the largest gain of 1.06%. The F Fund advanced by 0.68% thanks to the poor jobs data. The I Fund moved up by 0.18% while the C Fund gained 0.04%.

Strategy Allocations

Standard  50 Day    BTD          LR
50% G & 50% S 100% G 100% C 75% G & 25% S


BTD = Buy the Dip
LR = Low Risk
New Trades: None
See description of strategies here

TSP Fund Performance (6/3/2016 YTD)

G Fund F Fund C Fund S Fund I Fund
0.79% 4.23% 3.74% 3.64% 0.11%


Strategy Performance (6/3/2016 YTD)

Standard 50 Day  BTD   LR
-3.47% 2.93 1.79% -0.43%

Charts
1.  Daily S&P 500 (C Fund Proxy)

2.  Daily EFA (I Fund Proxy)

3.  Daily Wilshire 4500 (S Fund Proxy)

4.  Daily AGG (F Fund Proxy)

Get The Full Picture

Weekly Wrap Up

From Briefing.com
Newsletter 5/27/16 (Updated 6/2/16)

Quick Recap of the Week
Although trading volume was light, the stock market had a strong rally last week. Large, blue-chip stocks performed well, but small-cap and tech stocks did even better.

Economic Data
New home sales, durable orders and unemployment claims were better-than-expected. The odds of a June Federal Reserve interest rate hike are currently 30%. The odds of a July hike are just over 60%.

TSP Funds
The S Fund advanced the most with a 2.83% gain. The C Fund increased by 2.32% while the I Fund gained 2.23%. The F Fund had a fractional gain of 0.09%.

Strategy Allocations

Standard  50 Day    BTD          LR
50% G & 50% S> *100% G 100% C 75% G & 25% S


BTD = Buy the Dip
LR = Low Risk
New Trades: *IFT for 50 Day to 100% G Fund before noon EST on Friday, 6/3/16.
See description of strategies here

TSP Fund Performance (5/27/2016 YTD)

G Fund F Fund C Fund S Fund I Fund
0.76% 3.53% 3.69% 2.55% -0.07%


Strategy Performance (5/27/2016 YTD)

Standard 50 Day  BTD   LR
-3.81% 2.89% 1.75% -0.63%

Charts
1.  Daily S&P 500 (C Fund Proxy)

2.  Daily EFA (I Fund Proxy)

3.  Daily Wilshire 4500 (S Fund Proxy)

4.  Daily AGG (F Fund Proxy)

Get The Full Picture

Weekly Wrap Up

From Briefing.com
Newsletter 5/20/16 (updated 5/24/16)

Quick Recap of the Week
The S&P 500, Nasdaq and Russell 2000 moved up last week, breaking a 3-week losing streak for stocks.

Economic Data
Existing home sales and industrial production rose. On the negative side, the empire state manufacturing survey and Philly Fed index were worse-than-expected.

TSP Funds
The S Fund had the week’s biggest gain of 0.90%. The C Fund advanced by 0.35% while the I Fund gained 0.32%. The F Fund had a 0.57% loss.

Strategy Allocations

Standard  50 Day    BTD          LR
50% G & 50% C 100% C* 100% C 75% G & 25% C


BTD = Buy the Dip
LR = Low Risk
*New Trades: Interfund transfer (IFT) for 50 Day. Make IFT before noon EST on Wednesday, 5/25/16.  Updated 5/24/16.

See description of strategies here

TSP Fund Performance (5/20/2016 YTD)

G Fund F Fund C Fund S Fund I Fund
0.72% 3.43% 1.34% -0.27% -2.25%


Strategy Performance (5/20/2016 YTD)

Standard 50 Day  BTD   LR
-4.92% 2.42 -0.56% -1.22%

Charts
1.  Daily S&P 500 (C Fund Proxy)

2.  Daily EFA (I Fund Proxy)

3.  Daily Wilshire 4500 (S Fund Proxy)

4.  Daily AGG (F Fund Proxy)

Get The Full Picture

Weekly Wrap Up

From Briefing.com
Newsletter 5/13/16

Quick Recap of the Week
Stocks fell for the third straight week. Losses were moderate, however. The major indices continue to trade in narrow ranges.

Economic Data
Retail sales, consumer sentiment and job openings were better-than-expected. Jobless claims and business inventories came in below their forecasts.

TSP Funds
The S Fund declined the most with a 0.85% loss. The C Fund fell by 0.44% and the I Fund dropped 0.26%. The F Fund had a 0.29% gain.

Strategy Allocations

Standard  50 Day    BTD          LR
50% G & 50% C 100% G 100% C 75% G & 25% C


BTD = Buy the Dip
LR = Low Risk
New Trades: None
See description of strategies here

TSP Fund Performance (5/13/2016 YTD)

G Fund F Fund C Fund S Fund I Fund
0.69% 4.03% 0.98% -1.16% -2.57%


Strategy Performance (5/13/2016 YTD)

Standard 50 Day  BTD   LR
-5.11% 2.38 -0.91% -1.33%

Charts
1.  Daily S&P 500 (C Fund Proxy)

2.  Daily EFA (I Fund Proxy)

3.  Daily Wilshire 4500 (S Fund Proxy)

4.  Daily AGG (F Fund Proxy)

Get The Full Picture

Weekly Wrap Up

From Briefing.com