Tag Archives: TSP

Newsletter 9/30/14 (New Allocation)

New Interfund Transfer (IFT) and Contribution Allocation

We have a change to our allocation. We’re moving to 100% G Fund. Please make an IFT and update your Contribution Allocation before noon EST on Wednesday, 10/1/2014.

The returns and charts below haven’t changed since our 9/26/14 newsletter. We’ll send an updated newsletter this weekend.

  • YTD Return as of 9/26/14: 2.35%
  • Current allocation: 100% G Fund as of 10/1/14
  • New Trades: Interfund Transfer from 100% S Fund to 100% G Fund before noon EST on 10/1/14

TSP Fund Performance (9/26/2014 YTD)

G Fund F Fund C Fund S Fund I Fund
1.72% 4.61% 8.97% 2.43% -0.53%

Charts

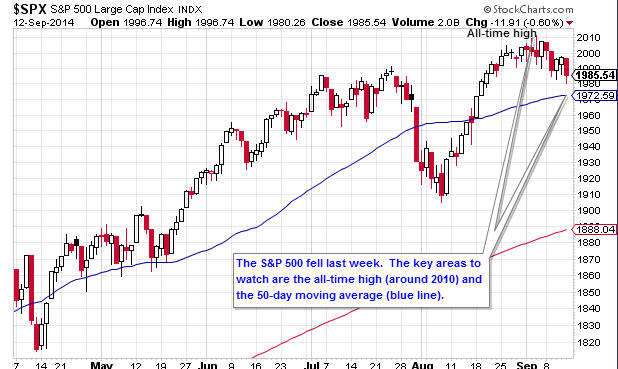
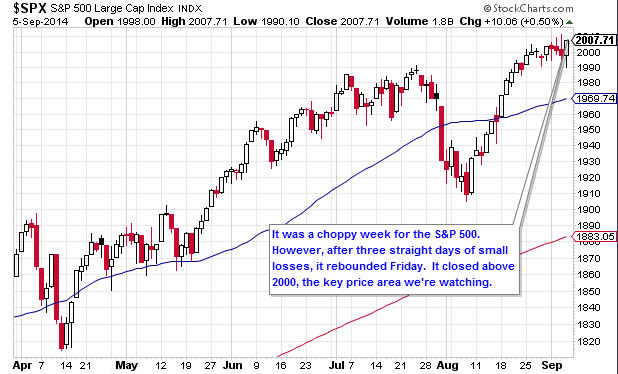
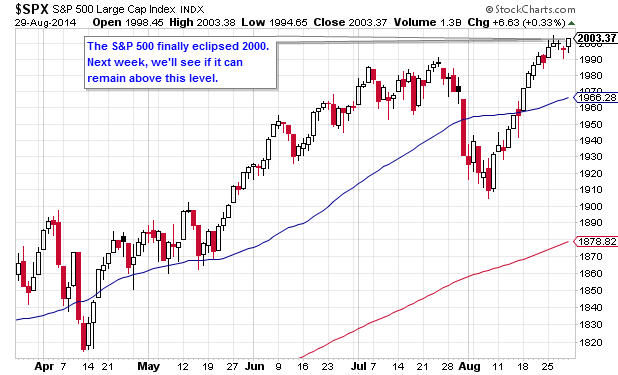
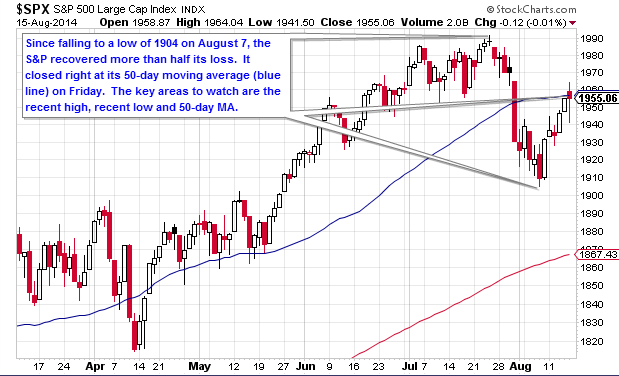
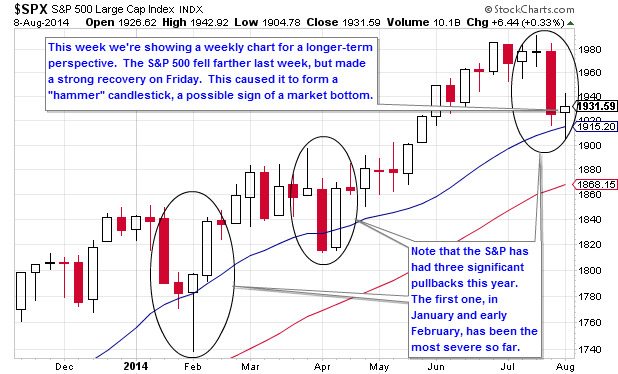
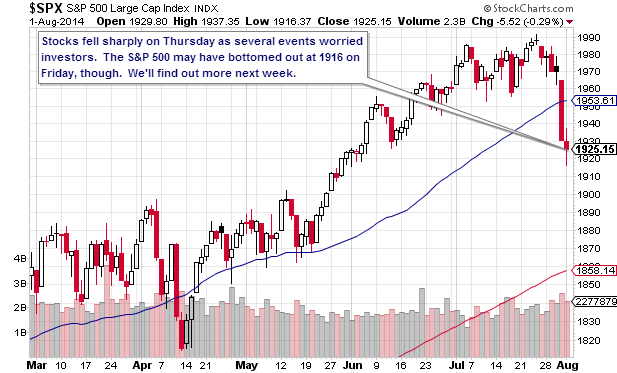
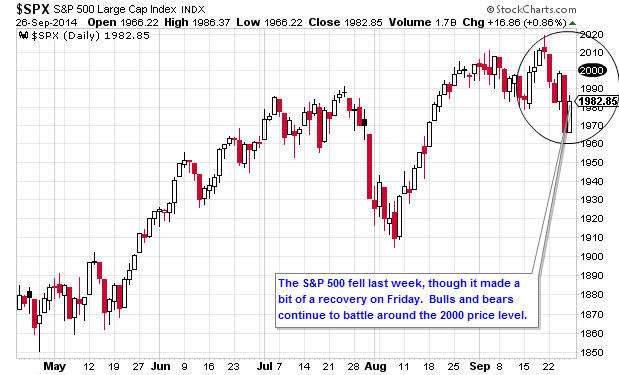
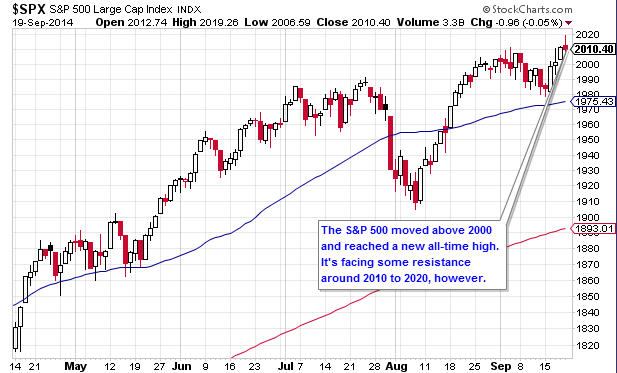
1.  Daily S&P 500 (C Fund Proxy)

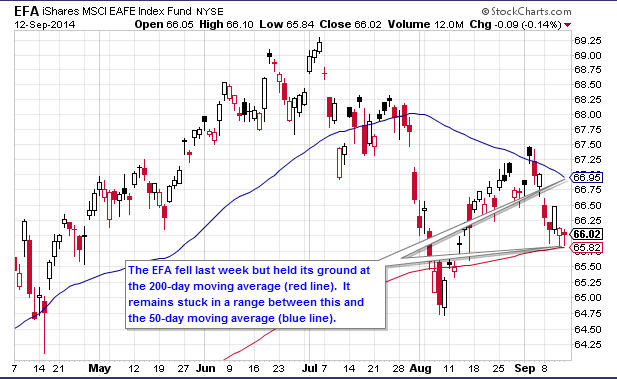
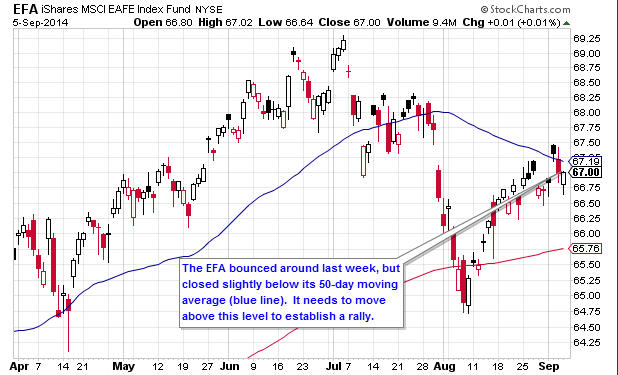
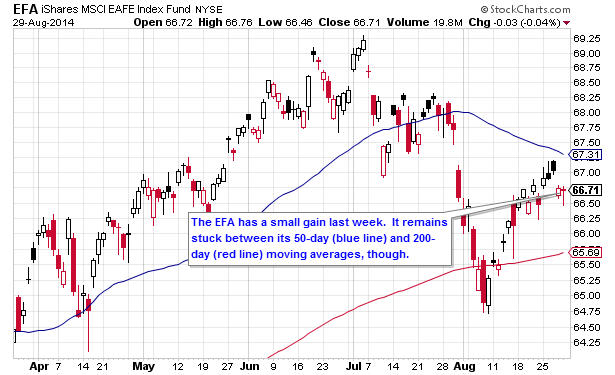
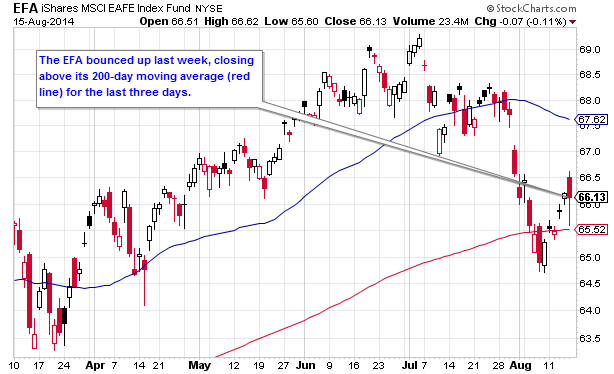
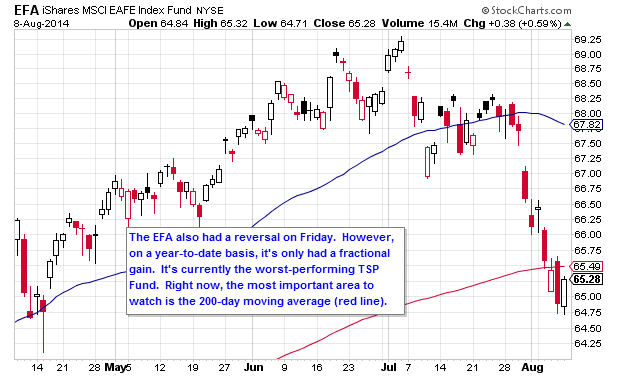
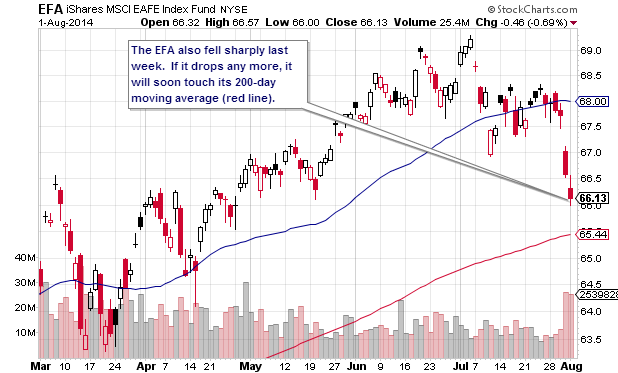
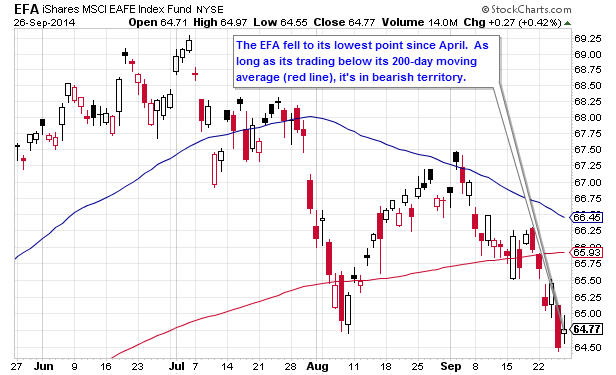
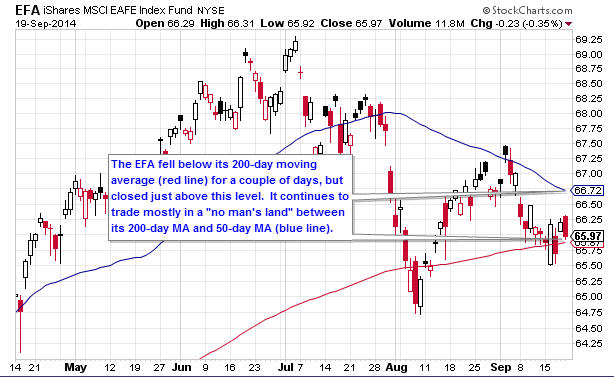
2.  Daily EFA (I Fund Proxy)

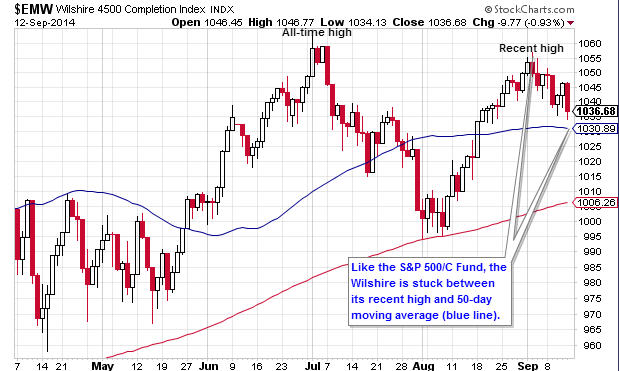
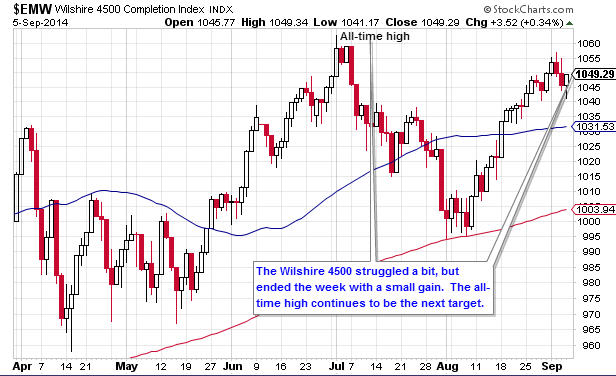
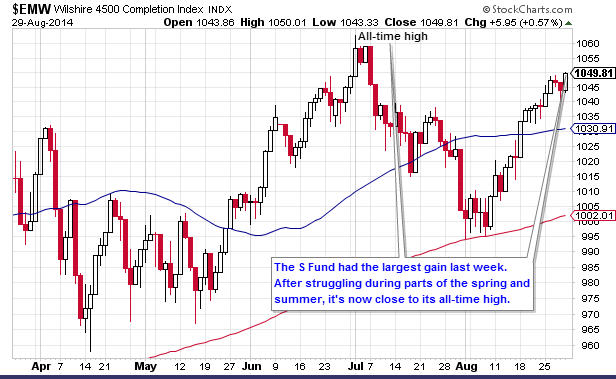
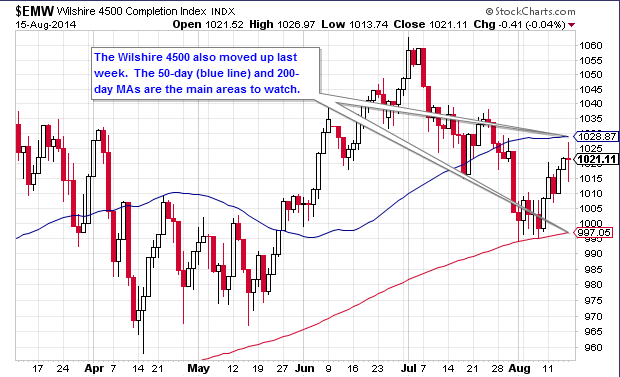
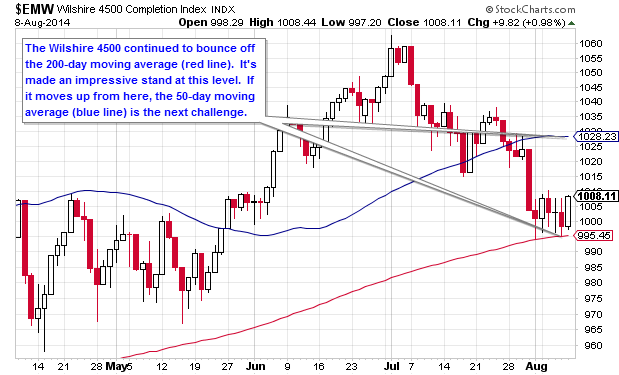
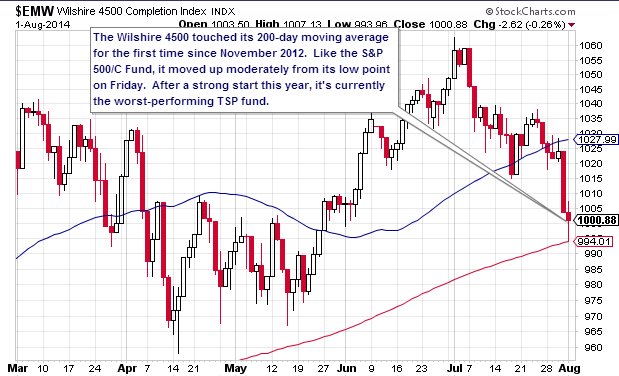
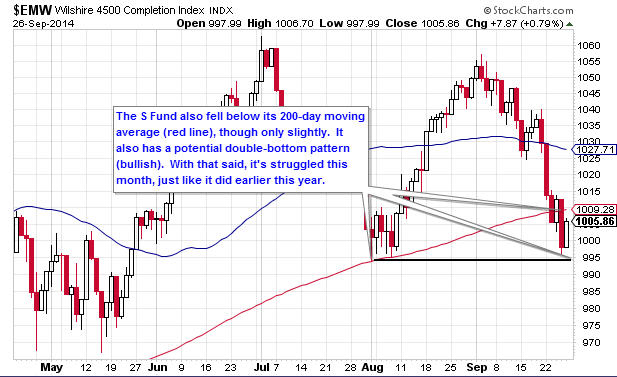
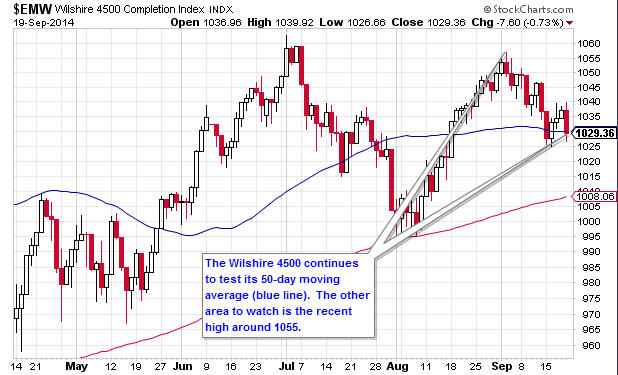
3.  Daily Wilshire 4500 (S Fund Proxy)

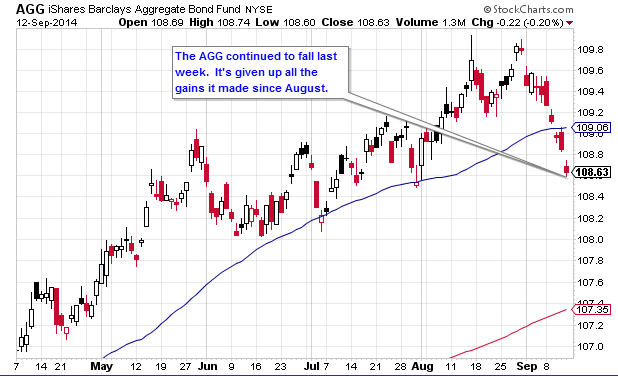
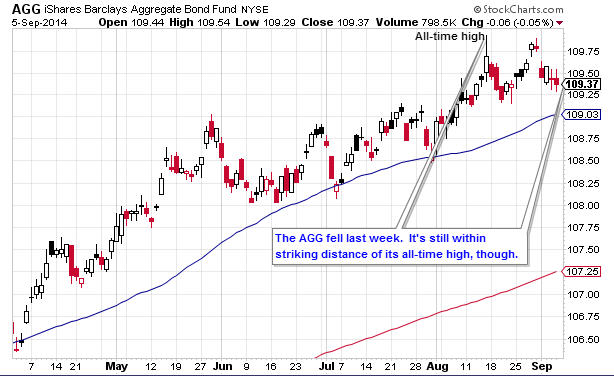
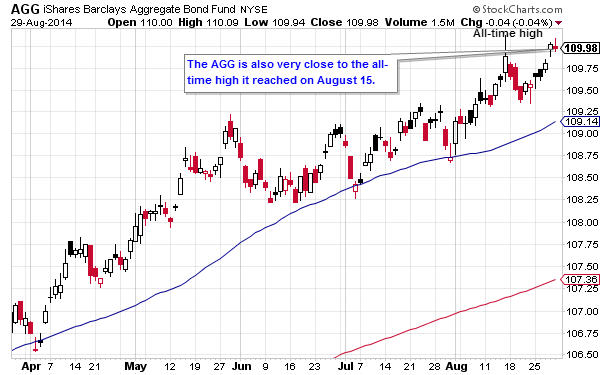
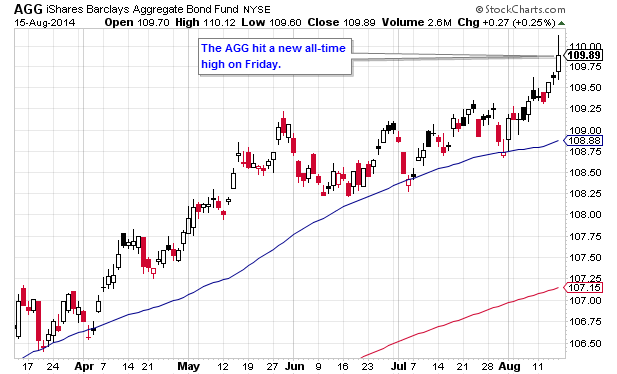
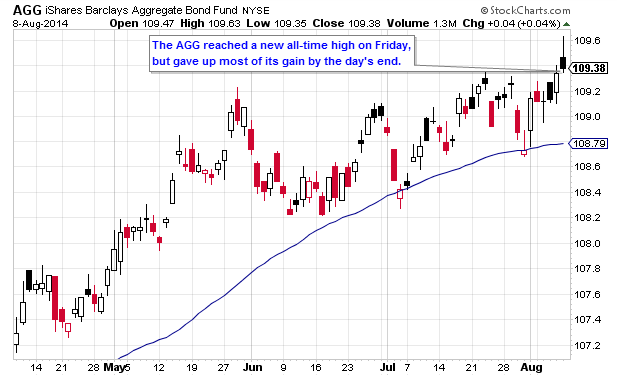
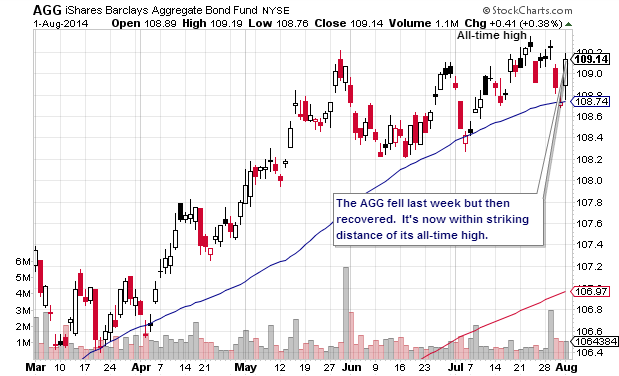
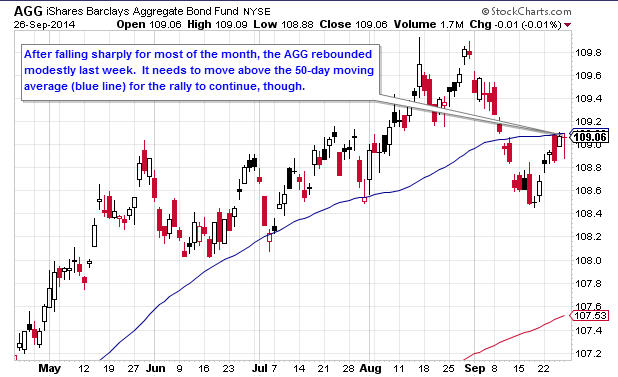
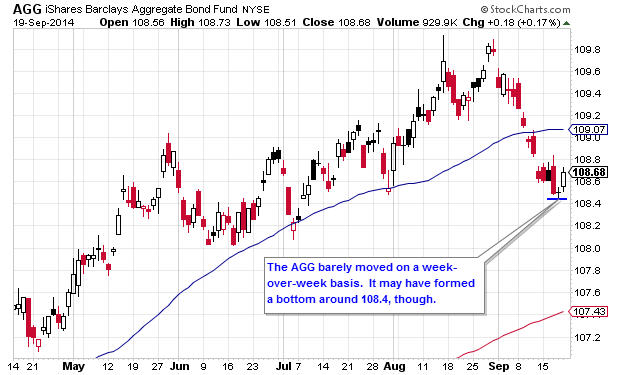
4.  Daily AGG (F Fund Proxy)

Get The Full Picture

Weekly Wrap Up

From Briefing.com
3 Mistakes TSP Investors Make

Let’s face it–investing isn’t easy.  Every day you hear conflicting reports from the financial world.  Friends, co-workers and experts recommend completely different investing approaches.

In this day of information overload, clear thinking is in short supply.  As a result, it’s easy to be indecisive.  It’s also easy to make a lot of poor decisions.

When it comes to the TSP, we often see three particular mistakes:  

  • Keeping a large permanent allocation in the G Fund
  • Avoiding certain TSP funds, even when they perform well
  • Following an adviser or strategy based on short-term results

In future posts, we’ll cover each mistake in detail.  For now, let’s go over the main points.

G Fund overload

A recent audit by the Federal Retirement Thrift Investment Board revealed that almost 45% of TSP assets were in the G Fund.  What’s worse, young people like the G Fund more than baby boomers.

Is it always wrong to put your money in the G Fund?  Certainly not.  In a bear market, it’s a smart move.  But stocks have moved up sharply since early 2009.  The C and S Funds have more than doubled their values since then.

Choose your funds wisely

While the G Fund is adored, other funds are shunned.  The F and I Funds are the least popular.  Maybe you’ve avoided them yourself? 

Hopefully not.  From 2004 to 2007, the I Fund was the strongest performer–by a large margin.  The F Fund had the best returns in 2008 and 2011. By contrast, the G Fund hasn’t been the top performer since 1994. 

What have you done for me lately….or what have you done for me long-term?

Chasing short-term performance is the last major mistake.  Imagine you can choose between two investing strategies:  

  • Strategy 1 has done very well for the last 15 years.  It’s been mediocre for the last three months, however.  
  • Strategy 2 has doubled the stock market’s return for the last three months.  But it only has a 2-year track record, and didn’t perform well until recently.  

Which sounds better to you?

The logical response is Strategy 1. Short-term results are just noise in the long-term picture. Yet some people choose a strategy/adviser based on the last 3 to 12 months of performance. It’s tempting to focus on recent activity, but years of performance is what matters.

Everyone makes mistakes. Now you’re armed with knowledge to prevent them. Don’t fall for common myths. Instead, let data and sound reasoning drive your decisions. For more specific guidance, sign up today for our service.

Newsletter 9/26/14

Quick Recap of the Week

The stock market fell last week.  There wasn’t much economic data in the U.S.  However, comments from officials in China and Japan pushed stocks lower early in the week.  The S and I Funds were hit the hardest, falling 2.49% and 2.20%, respectively.  The C dropped by 1.34%, while the F Fund rebounded with a 0.23% gain.

  • YTD Return as of 9/26/14: 2.35%
  • Current allocation: 100% S Fund as of 9/2/14
  • New Trades: None

TSP Fund Performance (9/26/2014 YTD)

G Fund F Fund C Fund S Fund I Fund
1.72% 4.61% 8.97% 2.43% -0.53%

Charts

1.  Daily S&P 500 (C Fund Proxy)

2.  Daily EFA (I Fund Proxy)

3.  Daily Wilshire 4500 (S Fund Proxy)

4.  Daily AGG (F Fund Proxy)

Get The Full Picture

Weekly Wrap Up

From Briefing.com
Newsletter 9/19/14

Quick Recap of the Week

The stock market ended the week with mixed results. Investors favored large-cap stocks, but shunned small-caps and other risky equities. The biggest news item was the Federal Reserve’s statement on Wednesday. The Fed left rates at all-time lows, but reduced its bond purchases.

The C Fund ended the week 1.27% higher, while the I Fund remained flat with a 0.04% gain. The S Fund fell 0.67%, while the F Fund gained 0.18%.

  • YTD Return as of 9/19/14: 4.70%
  • Current allocation: 100% S Fund as of 9/2/14
  • New Trades: None

TSP Fund Performance (9/19/2014 YTD)

G Fund F Fund C Fund S Fund I Fund
1.68% 4.38% 10.45% 4.78% 1.70%

Charts

1.  Daily S&P 500 (C Fund Proxy)

2.  Daily EFA (I Fund Proxy)

3.  Daily Wilshire 4500 (S Fund Proxy)

4.  Daily AGG (F Fund Proxy)

Get The Full Picture

Weekly Wrap Up

From Briefing.com
Newsletter 9/12/14

Quick Recap of the Week

Both stocks and bonds fell last week. Weakness in the energy sector caused the broader markets to fall.  The TSP stock funds fell by similar amounts.  The I Fund declined 1.30%, while the C fell 1.05% and the S dropped by 1.00%.  The F Fund moved down 0.65%.

  • YTD Return as of 9/12/14: 5.41%
  • Current allocation: 100% S Fund as of 9/2/14
  • New Trades: None

TSP Fund Performance (9/12/2014 YTD)

G Fund F Fund C Fund S Fund I Fund
1.64% 4.18% 9.06% 5.49% 1.66%

Charts

1.  Daily S&P 500 (C Fund Proxy)

2.  Daily EFA (I Fund Proxy)

3.  Daily Wilshire 4500 (S Fund Proxy)

4.  Daily AGG (F Fund Proxy)

Get The Full Picture

Weekly Wrap Up

From Briefing.com
Newsletter 9/05/14

Quick Recap of the Week

The holiday-shortened week was choppy and indecisive for the stock market. Most economic data was favorable. However, Friday’s employment report was worse-than-expected. The TSP funds had mixed results.  The C and I Funds moved up by 0.25 and 0.13%, respectively. The S Fund declined 0.06% while the F Fund fell by 0.45%.

  • YTD Return as of 9/5/14: 6.47%
  • Current allocation: 100% S Fund as of 9/2/14
  • New Trades: None

TSP Fund Performance (9/5/2014 YTD)

G Fund F Fund C Fund S Fund I Fund
1.60% 4.86% 10.22% 6.55% 3.00%

Charts

1.  Daily S&P 500 (C Fund Proxy)

2.  Daily EFA (I Fund Proxy)

3.  Daily Wilshire 4500 (S Fund Proxy)

4.  Daily AGG (F Fund Proxy)

Get The Full Picture

Weekly Wrap Up

From Briefing.com
Newsletter 8/29/14

Quick Recap of the Week

Stocks closed on Friday with a gain for the week and for the month.  There wasn’t much market-related news. The biggest item was the Chicago Purchasing Manager’s Index, which was better than expected. The S Fund led the TSP, advancing 1.12%. Following it were the C Fund with a 0.80% gain and the I Fund, which moved up 0.62%. The F Fund rose by 0.38% as bonds had another strong week.

  • YTD Return as of 8/29/14: 6.97%
  • Current allocation: 100% S Fund as of 9/2/14
  • New Trades: IFT and new Contribution Allocation to 100% S Fund before noon EST on Tuesday, 9/2/14.

TSP Fund Performance (8/29/2014 YTD)

G Fund F Fund C Fund S Fund I Fund
1.57% 5.34% 9.94% 6.62% 2.86%

Charts

1.  Daily S&P 500 (C Fund Proxy)

2.  Daily EFA (I Fund Proxy)

3.  Daily Wilshire 4500 (S Fund Proxy)

4.  Daily AGG (F Fund Proxy)

Get The Full Picture

Weekly Wrap Up

From Briefing.com
Newsletter 8/15/14

Quick Recap of the Week

The stock market moved up again last week.  The S Fund led the way with a 1.40% gain.  The C and I Funds were close behind, with gains of 1.29% and 1.16%, respectively.  The F Fund increased by 0.45%.  There was no clear catalyst for the rally.  Economic data releases had mixed results.  Most likely, the rally was a continuing technical bounce after the recent pullback.

  • YTD Return as of 8/15/14: 4.29%
  • Current allocation: 100% C Fund as of 6/20/14
  • New Trades: None

TSP Fund Performance (8/15/2014 YTD)

G Fund F Fund C Fund S Fund I Fund
1.46% 5.16% 7.19% 3.55% 1.45%

Charts

1.  Daily S&P 500 (C Fund Proxy)

2.  Daily EFA (I Fund Proxy)

3.  Daily Wilshire 4500 (S Fund Proxy)

4.  Daily AGG (F Fund Proxy)

Get The Full Picture

Weekly Wrap Up

From Briefing.com
Newsletter 8/8/14

Quick Recap of the Week

Thanks to a large rally on Friday, the U.S. stock market finished last week with a gain.  The S Fund was the top TSP performer with a 0.8% increase.  The C Fund moved up 0.4%, followed by the F Fund with a 0.29% gain.  The I Fund lost ground, falling by 1.92%.

  • YTD Return as of 8/8/14: 2.97%
  • Current allocation: 100% C Fund as of 6/20/14
  • New Trades: None

TSP Fund Performance (8/8/2014 YTD)

G Fund F Fund C Fund S Fund I Fund
1.42% 4.69% 5.83% 2.13% 0.28%

Charts

1.  Daily S&P 500 (C Fund Proxy)

2.  Daily EFA (I Fund Proxy)

3.  Daily Wilshire 4500 (S Fund Proxy)

4.  Daily AGG (F Fund Proxy)

Get The Full Picture

Weekly Wrap Up

From Briefing.com
Newsletter 8/1/14

Quick Recap of the Week

The TSP stock funds all fell last week.  Once again, the week began with choppy, indecisive trading.  However, stocks fell sharply on Thursday.  Poor earnings reports in the U.S. and tensions overseas frightened investors.  The C, S and I Funds took similar hits, falling by 2.66%, 2.46% and 2.12%, respectively.  The F Fund had a 0.1% loss.

  • YTD Return as of 8/1/14: 2.56%
  • Current allocation: 100% C Fund as of 6/20/14
  • New Trades: None

TSP Fund Performance (8/1/2014 YTD)

G Fund F Fund C Fund S Fund I Fund
1.37% 4.38% 5.41% 1.31% 2.24%

Charts

1.  Daily S&P 500 (C Fund Proxy)

2.  Daily EFA (I Fund Proxy)

3.  Daily Wilshire 4500 (S Fund Proxy)

4.  Daily AGG (F Fund Proxy)

Get The Full Picture

Weekly Wrap Up

From Briefing.com