Tag Archives: TSP Funds

Newsletter 4/29/16

Quick Recap of the Week
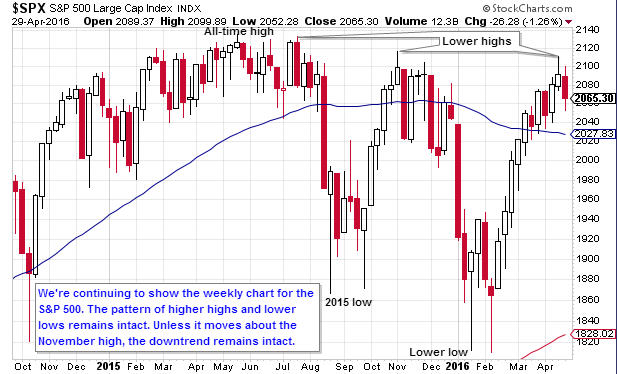
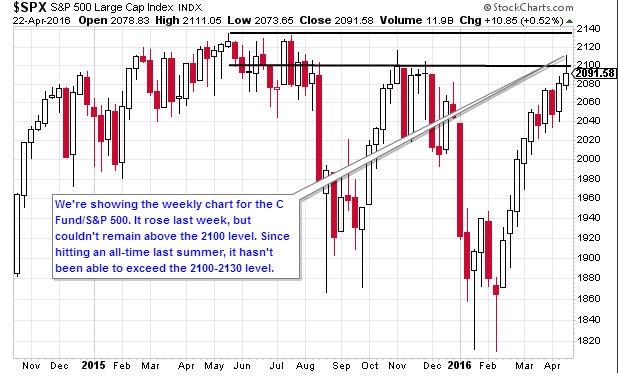
Stocks fell last week. Once again, 2100 acted as a ceiling for the S&P 500. After falling to almost 2050 on Friday, the S&P 500 had a modest bounce, however.

Economic Data
Initial jobless claims and the Richmond manufacturing survey were better-than-expected. On the negative side, durable goods, consumer confidence and the U.S. economy’s gross domestic product came in below expectations.

TSP Funds
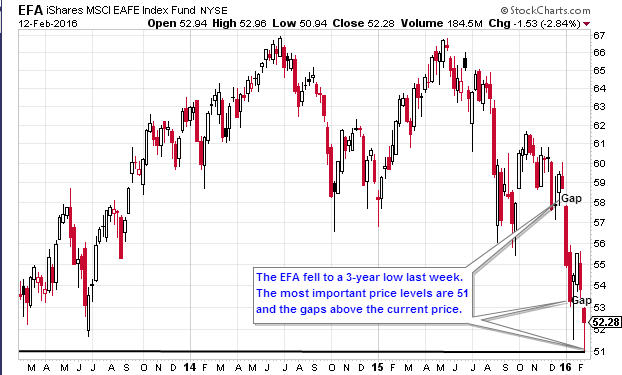
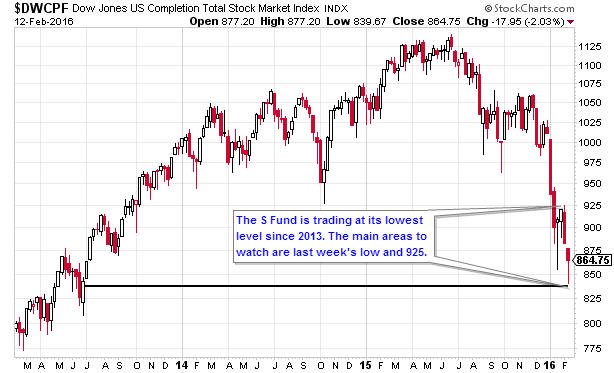
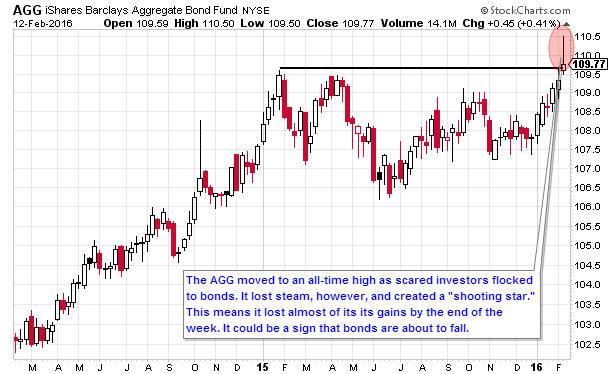
The I Fund had the biggest loss of 1.46%. The C Fund fell 1.24%, while the S Fund dropped by 1.07%. The F Fund rose by 0.41%.

Strategy Allocations

Standard  50 Day    BTD          LR
50% G & 50% C* 100% G 100% C* 75% G & 25% C*


BTD = Buy the Dip
LR = Low Risk
New Trades: Standard, BTD and LR have new interfund transfers as of 4/29/16. Please make IFTs before noon EST on 5/2/16.
See description of strategies here

TSP Fund Performance (4/29/2016 YTD)

G Fund F Fund C Fund S Fund I Fund
0.63% 3.55% 1.77% 1.02% -0.39%


Strategy Performance (4/29/2016 YTD)

Standard 50 Day  BTD   LR
-5.14% 2.32 0.63% -1.38%

Charts
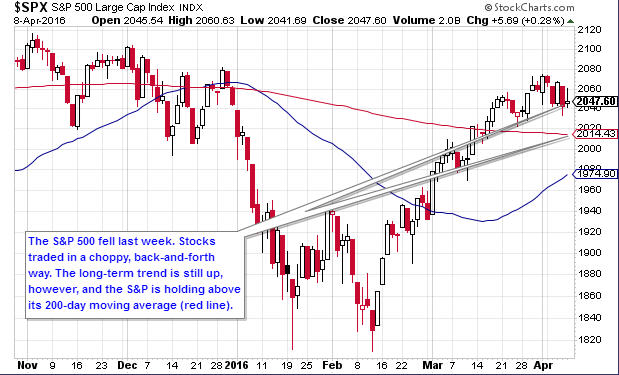
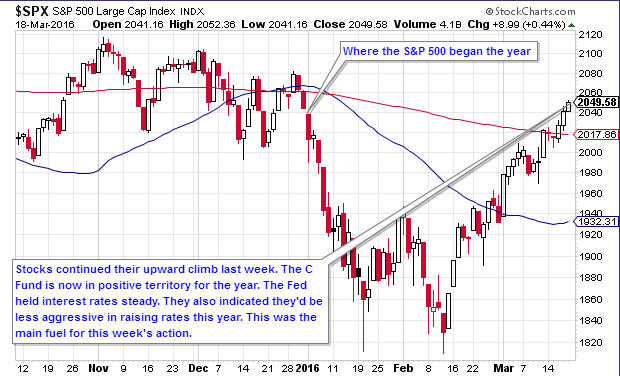
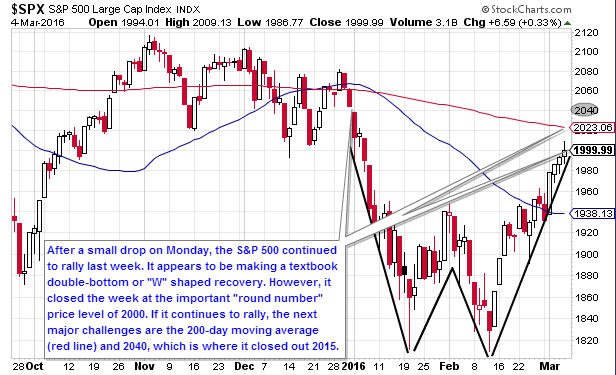
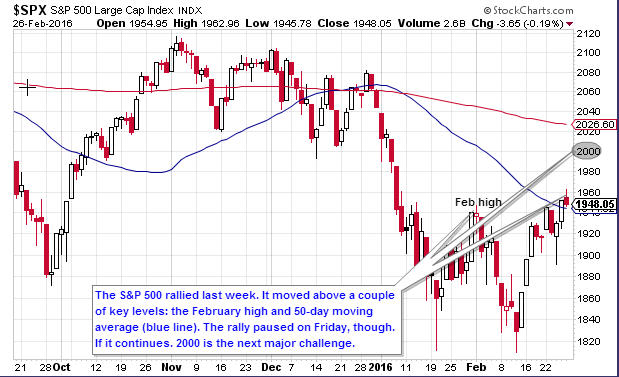
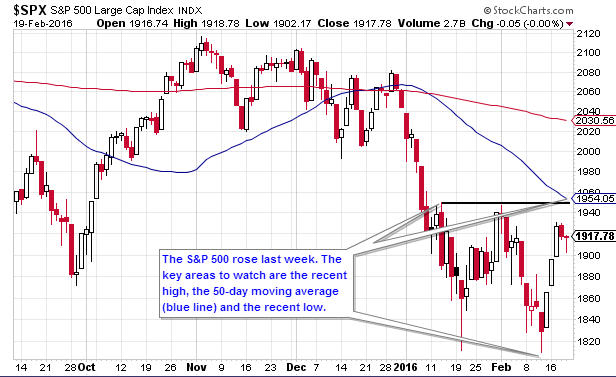
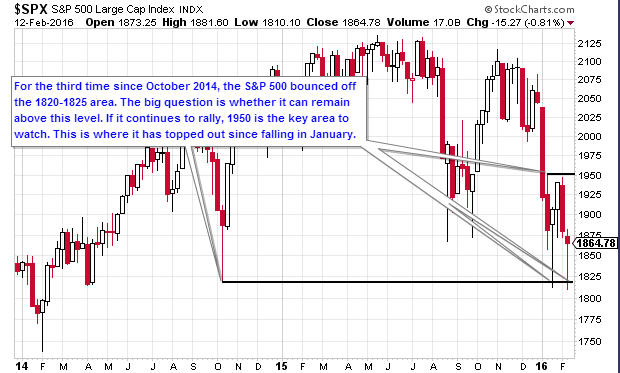
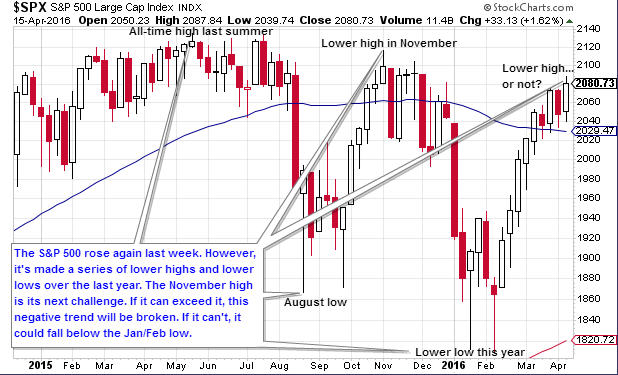
1.  Daily S&P 500 (C Fund Proxy)

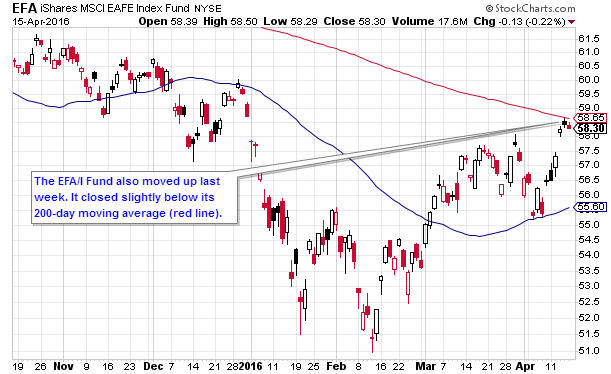
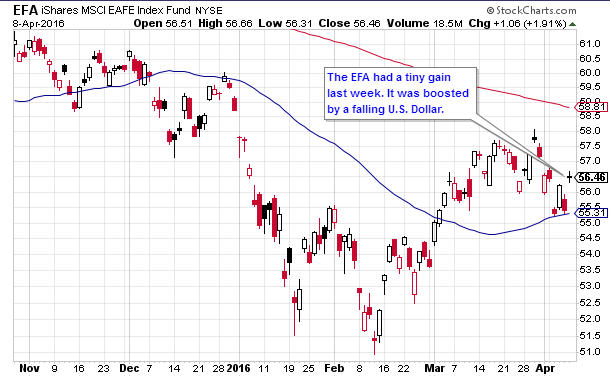
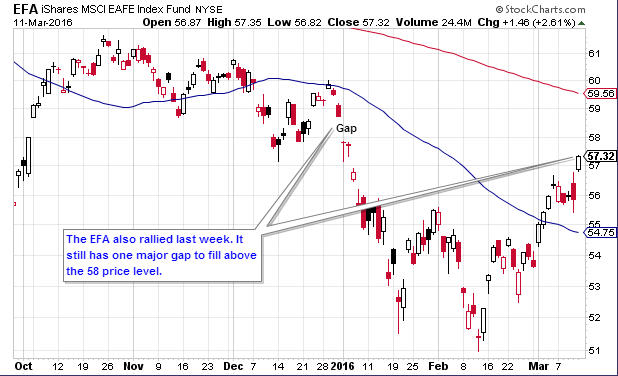
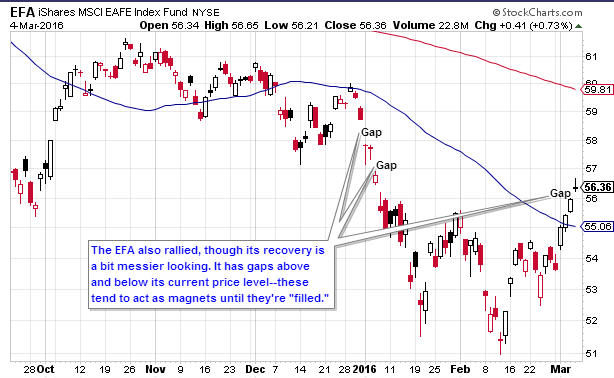
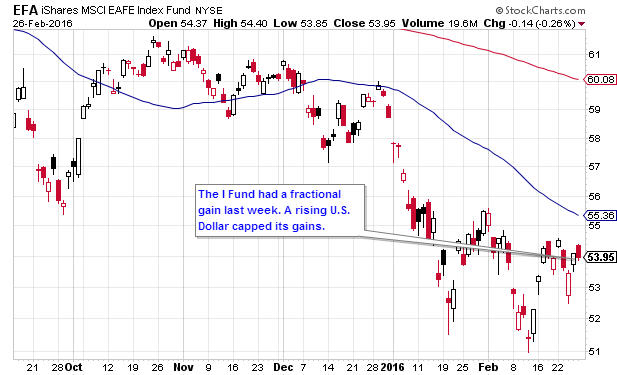
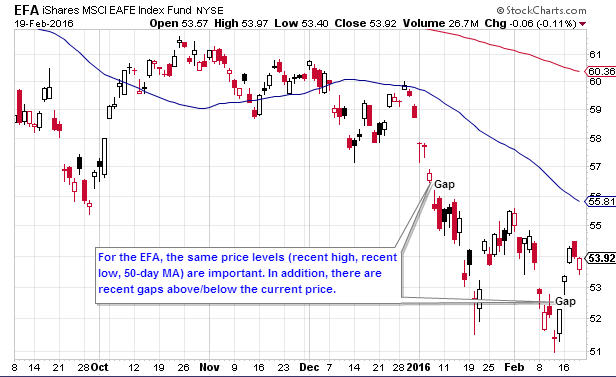
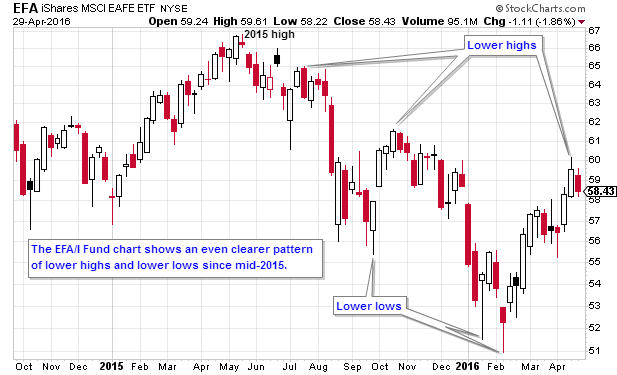
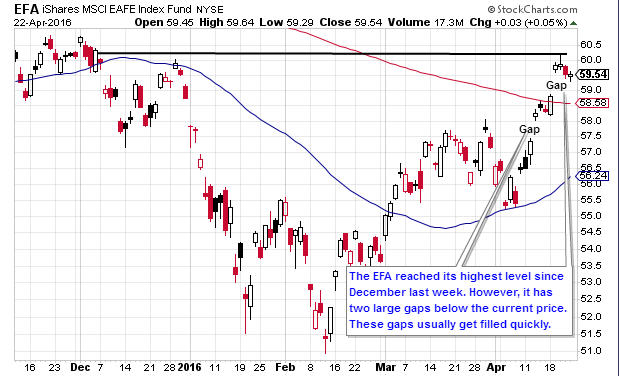
2.  Daily EFA (I Fund Proxy)

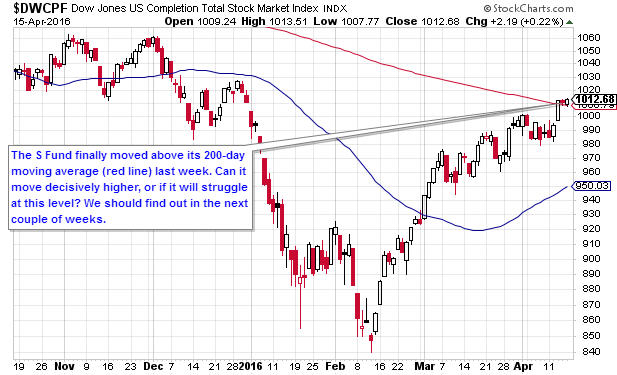
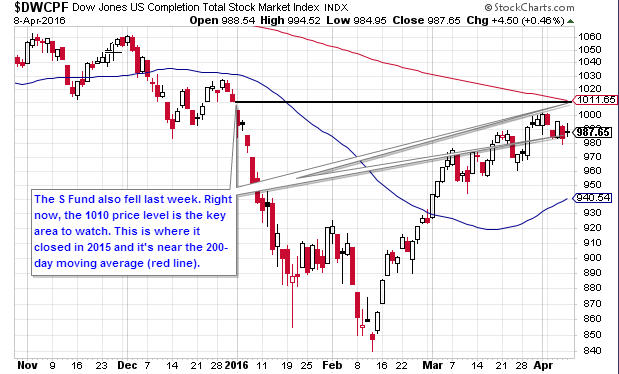
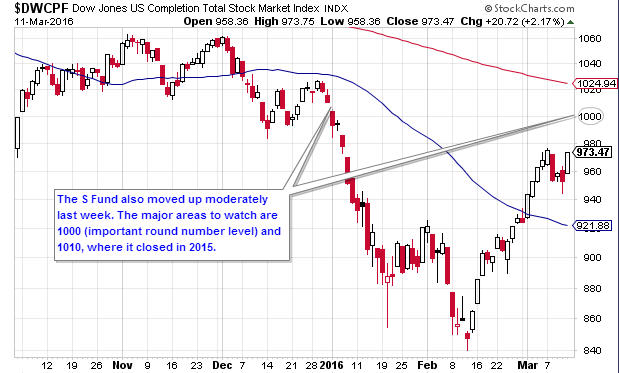
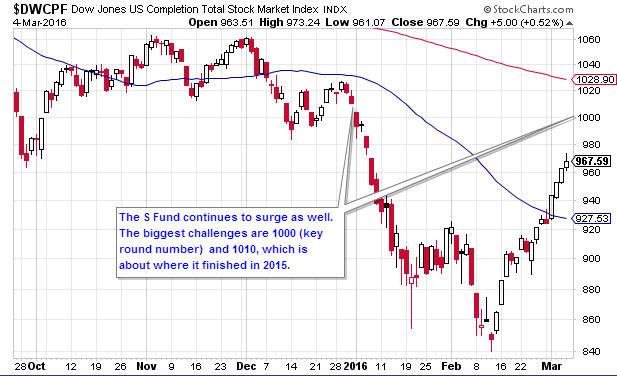
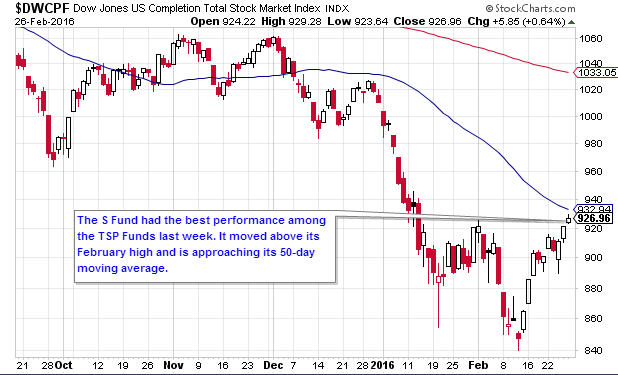
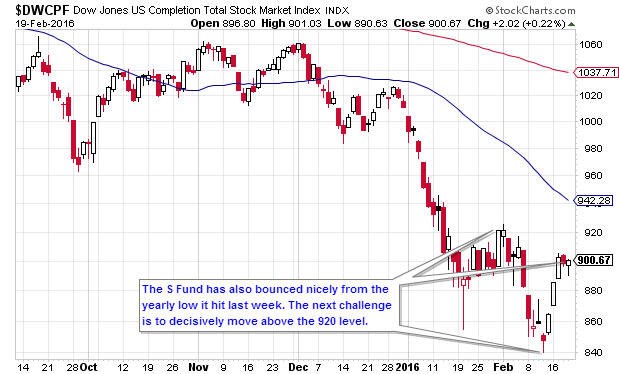
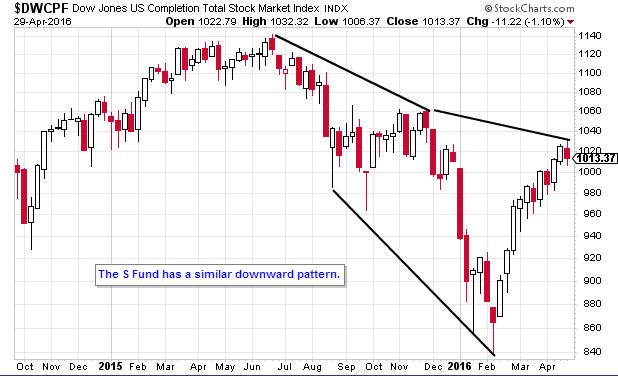
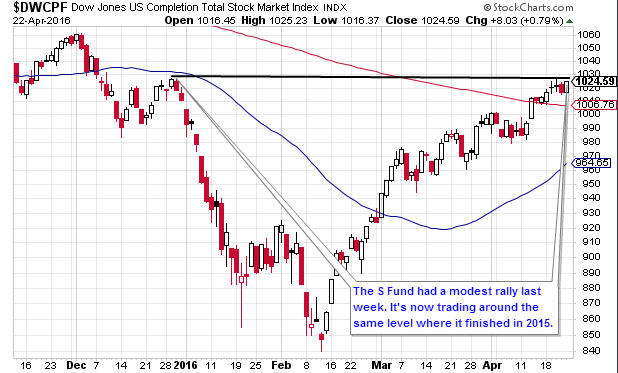
3.  Daily Wilshire 4500 (S Fund Proxy)

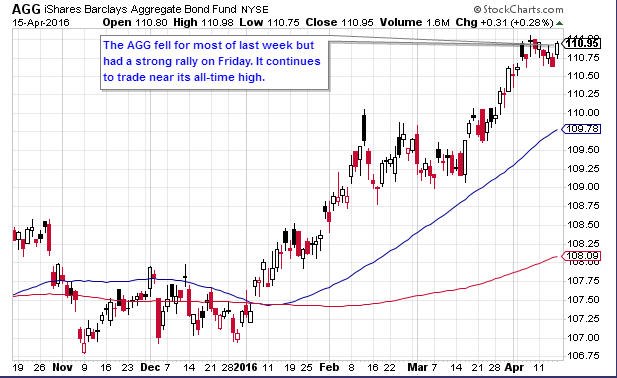
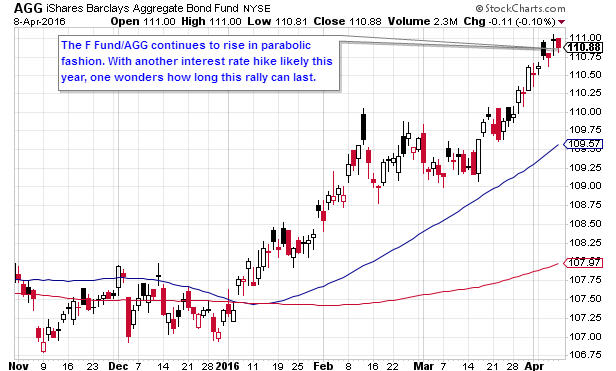
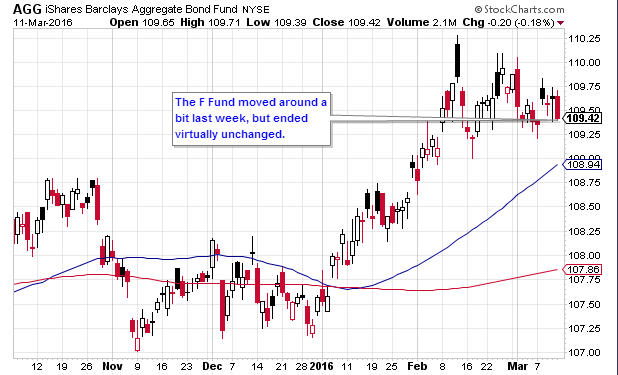
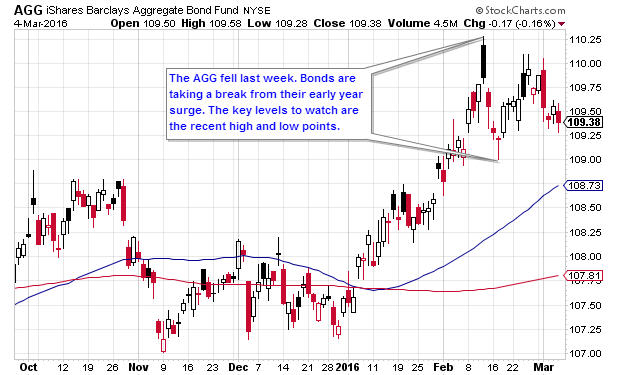
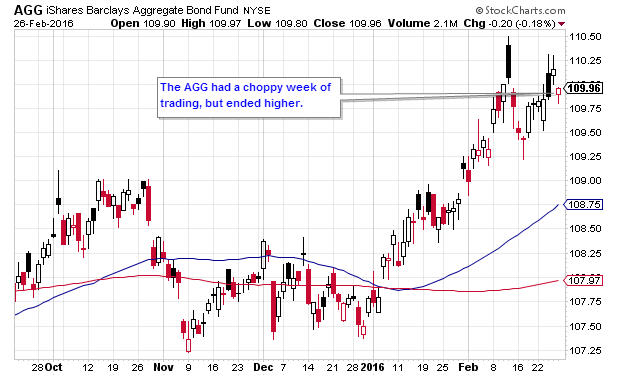
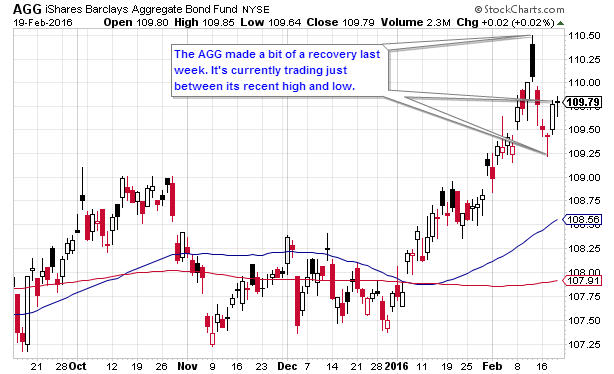
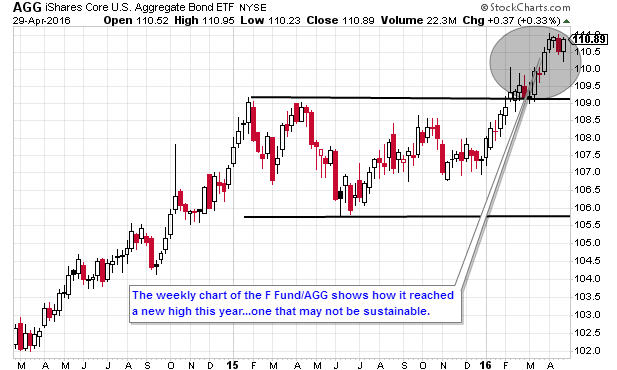
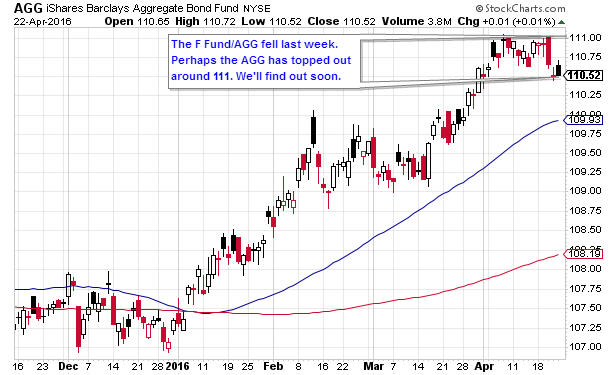
4.  Daily AGG (F Fund Proxy)

Get The Full Picture

Weekly Wrap Up

From Briefing.com
Newsletter 4/22/16

Quick Recap of the Week
The stock market moved up last week. The S&P 500 touched the 2100 level for the first time since early December. Small-caps were the best performers, while tech stocks lagged the broader market.

Economic Data
Initial jobless claims fell to a 40+ year low. Existing home sales were also better-than-expected. On the negative side, US housing starts and housing permits were worse-than-expected.

TSP Funds
The I Fund had the biggest gain of 1.31%. The S Fund advanced by 1.22% and the C Fund had a gain of 0.53%. The F Fund had a loss of 0.41%.

Strategy Allocations

Standard  50 Day    BTD          LR
100% C 100% G 100% G 50% G & 50% C


BTD = Buy the Dip
LR = Low Risk
New Trades: none
See description of strategies here

TSP Fund Performance (4/22/2016 YTD)

G Fund F Fund C Fund S Fund I Fund
0.59% 3.13% 3.05% 2.11% 1.08%


Strategy Performance (4/22/2016 YTD)

Standard 50 Day  BTD   LR
-3.95% 2.28% 0.59% -0.79%

Charts
1.  Daily S&P 500 (C Fund Proxy)

2.  Daily EFA (I Fund Proxy)

3.  Daily Wilshire 4500 (S Fund Proxy)

4.  Daily AGG (F Fund Proxy)

Get The Full Picture

Weekly Wrap Up

From Briefing.com
Newsletter 4/15/16

Quick Recap of the Week
Stocks rallied last week. Most indices reached their highest level since late 2015. Small-caps had the biggest gains, but almost all sectors performed well.

Economic Data
Initial jobless claims and the Empire State manufacturing index were better-than-expected. However, retail sales, industrial production and consumer sentiment came in below their forecasts.

TSP Funds
The I Fund led the way with a 3.62 gain, followed by the S Fund, which rose 2.58%. The C Fund increased by 1.65%, while the F Fund was flat, gaining only 0.01%.

Strategy Allocations

Standard  50 Day    BTD          LR
100% C 100% G 100% G 50% G & 50% C


BTD = Buy the Dip
LR = Low Risk
New Trades: none
See description of strategies here

TSP Fund Performance (4/15/2016 YTD)

G Fund F Fund C Fund S Fund I Fund
0.56% 3.55% 2.50% 0.89% -0.22%


Strategy Performance (4/15/2016 YTD)

Standard 50 Day  BTD   LR
-4.46% 2.25% 0.56% -1.07%

Charts
1.  Daily S&P 500 (C Fund Proxy)

2.  Daily EFA (I Fund Proxy)

3.  Daily Wilshire 4500 (S Fund Proxy)

4.  Daily AGG (F Fund Proxy)

Get The Full Picture

Weekly Wrap Up

From Briefing.com
Newsletter 4/8/16

Quick Recap of the Week
After March’s big rally, stocks fell moderately last week. International stocks performed better than domestic stocks due to a falling U.S. Dollar.

Economic Data
The ISM services index and jobless claims were better-than-expected. On the negative side, factory orders and auto inventories came in below their forecasts.

TSP Funds
The S Fund had the largest loss of 1.34%. The C Fund fell 1.15%, while the I Fund managed to make a 0.08% gain. The F Fund rose by 0.43%.

Strategy Allocations

Standard  50 Day    BTD          LR
100% C 100% G 100% G 50% G & 50% C


BTD = Buy the Dip
LR = Low Risk
New Trades: none
See description of strategies here

TSP Fund Performance (4/8/2016 YTD)

G Fund F Fund C Fund S Fund I Fund
0.53% 3.54% 0.84% -1.65% -3.71%


Strategy Performance (4/8/2016 YTD)

Standard 50 Day  BTD   LR
-6.01% 2.21 0.53% -1.89%

Charts
1.  Daily S&P 500 (C Fund Proxy)

2.  Daily EFA (I Fund Proxy)

3.  Daily Wilshire 4500 (S Fund Proxy)

4.  Daily AGG (F Fund Proxy)

Get The Full Picture

Weekly Wrap Up

From Briefing.com
Newsletter 3/18/16

Quick Recap of the Week
Stocks moved up again last week. The main driver was the Federal Reserve. They didn’t raise interest rates at their meeting on Wednesday. The Fed anticipates two more rate hikes this year–not four as they previously said. This “dovish” language pushed stocks higher towards the end of the week.

Economic Data
Housing starts and the empire state manufacturing survey were better-than-expected. However, building permits and consumer sentiment came in below expectations.

TSP Funds
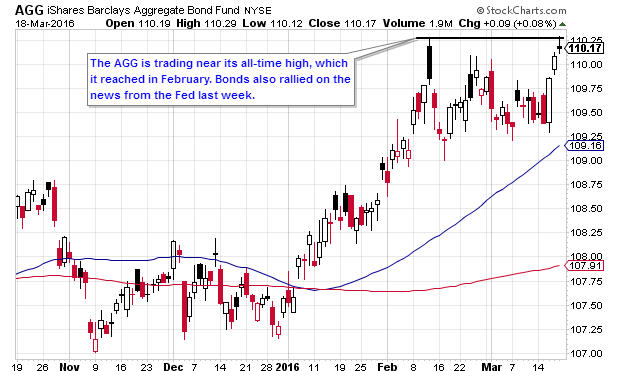
The C Fund had the largest gain of 1.37%, followed closely by the S Fund’s 1.32% gain. The I Fund advanced by 1.01%. The F Fund moved up 0.78% as bonds also rallied after the Fed meeting.

Strategy Allocations

Standard  50 Day    BTD          LR
50% G & 50% C 100% C* 100% G 75% G & 25% C


BTD = Buy the Dip
LR = Low Risk
*New Trades: IFT for 50 Day to 100% C Fund before noon EST on Monday, 3/21
See description of strategies here

TSP Fund Performance (3/18/2016 YTD)

G Fund F Fund C Fund S Fund I Fund
0.43% 2.52% 0.82% -1.95% -2.03%


Strategy Performance (3/18/2016 YTD)

Standard 50 Day  BTD   LR
-5.50% 1.49 0.43% -1.68%

Charts
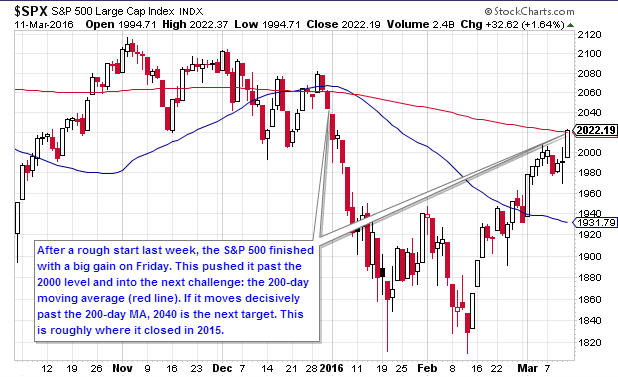
1.  Daily S&P 500 (C Fund Proxy)

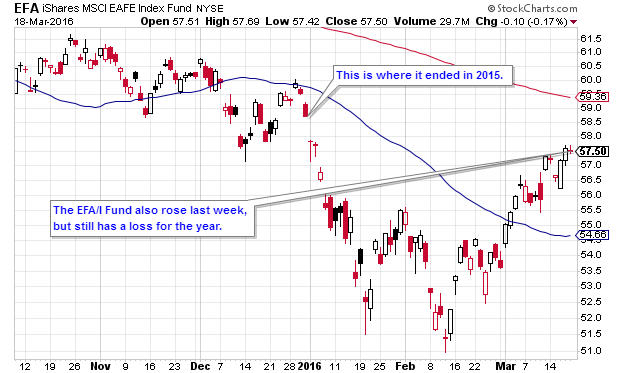
2.  Daily EFA (I Fund Proxy)

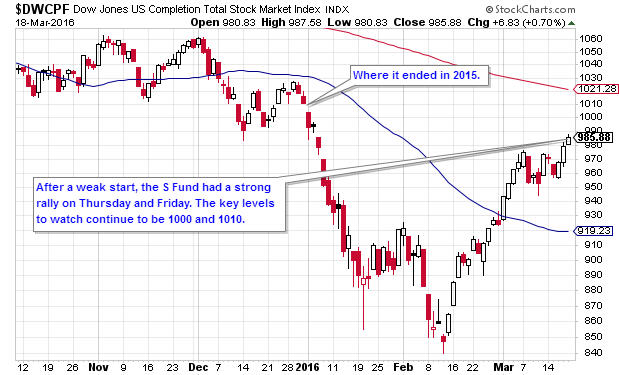
3.  Daily Wilshire 4500 (S Fund Proxy)

4.  Daily AGG (F Fund Proxy)

Get The Full Picture

Weekly Wrap Up

From Briefing.com
Newsletter 3/11/16

Quick Recap of the Week
Stocks were in slightly negative territory until Friday. The S&P 500 had trouble moving past the 2000 price level. As we indicated last week, this was a clear resistance area.

However, the major stock indices had large gains on Friday. They’re now at their highest levels since early January.

Economic Data
Jobless claims and mortgage applications were better-than-expected. In addition, the European Central Bank lowered its interest rate, going further into negative territory. This may not be a smart move in the long run, but for now it’s pushing stocks higher.

TSP Funds
The C Fund had the largest gain of 1.19%. Following it were the I Fund with a 1.05% advance, and the S Fund’s 0.66% gain. The F Fund had a tiny loss of 0.09%.

Strategy Allocations

Standard  50 Day    BTD          LR
50% G & 50% C 100% G 100% G 75% G & 25% C


BTD = Buy the Dip
LR = Low Risk
New Trades: none
See description of strategies here

TSP Fund Performance (3/11/2016 YTD)

G Fund F Fund C Fund S Fund I Fund
0.39% 1.73% -0.54% -3.23% -3.01%


Strategy Performance (3/11/2016 YTD)

Standard 50 Day  BTD   LR
-6.16% 1.46% 0.39% -2.04%

Charts
1.  Daily S&P 500 (C Fund Proxy)

2.  Daily EFA (I Fund Proxy)

3.  Daily Wilshire 4500 (S Fund Proxy)

4.  Daily AGG (F Fund Proxy)

Get The Full Picture

Weekly Wrap Up

From Briefing.com
Newsletter 3/5/16

Quick Recap of the Week
Stocks rose for the third straight week. It ended with the S&P 500 closing a fraction below 2000 on Friday. So far, stocks haven’t run into resistance since they began recovering in mid-February. However, the key price level of 2000 could be a major test.

Economic Data
Employment data was better-than-expected, as was the ISM Non-Manufacturing index, construction spending and factory orders. On the negative side, the PMI Services Index and pending home sales fell.

TSP Funds
The I Fund led the TSP with a 4.66 gain, followed closely by the S Fund, which rose 4.44%. The C Fund increased by 2.71%, while the F Fund fell 0.21%.

Strategy Allocations

Standard  50 Day    BTD          LR
50% G & 50% C 100% G 100% G 75% G & 25% C


BTD = Buy the Dip
LR = Low Risk
New Trades: none
See description of strategies here

TSP Fund Performance (3/4/2016 YTD)

G Fund F Fund C Fund S Fund I Fund
0.36% 1.82% -1.71% -3.87% -4.01%


Strategy Performance (3/4/2016 YTD)

Standard 50 Day  BTD   LR
-6.73% 1.43 0.36% -2.36%

Charts
1.  Daily S&P 500 (C Fund Proxy)

2.  Daily EFA (I Fund Proxy)

3.  Daily Wilshire 4500 (S Fund Proxy)

4.  Daily AGG (F Fund Proxy)

Get The Full Picture

Weekly Wrap Up

From Briefing.com
Newsletter 2/26/16

Quick Recap of the Week
Stocks rose for a second straight week. All of the major U.S. stock indices had gains.

Economic Data
There were many economic data releases. On the positive side, gross domestic product, durable goods orders, home sales, consumer sentiment and the Case-Shiller Home Price Index were better-than-expected.

Coming in below expectations were the services index, consumer confidence and new home sales. Also on the negative side was the Core PCE Index, the Federal Reserve’s favorite measure of inflation. It was higher than expected. This may increase the odds of another interest rate hike this year.

TSP Funds
The S Fund led the way with a 2.96% gain. The C Fund followed, advancing 1.63%. The I Fund had a small gain of 0.18%, while the F Fund inched up by 0.02%.

System Allocations

TSP Standard*    BTD          LR
50% G & 50% C 100% G 75% G & 25% C


BTD = Buy the Dip
LR = Low Risk
New Trades*: For TSP Standard, IFT from 50% G and 50% S to 50% G and 50% C before noon EST on 2/29/2016
See description of systems here

TSP Fund Performance (2/26/2016 YTD)

G Fund F Fund C Fund S Fund I Fund
0.32% 2.03% -4.30% -7.95% -8.29%


System Performance (2/26/2016 YTD)

Standard  BTD   LR
-8.21% 0.32% -3.04%

Charts
1.  Daily S&P 500 (C Fund Proxy)

2.  Daily EFA (I Fund Proxy)

3.  Daily Wilshire 4500 (S Fund Proxy)

4.  Daily AGG (F Fund Proxy)

Get The Full Picture

Weekly Wrap Up

From Briefing.com
Newsletter 2/19/15

Quick Recap of the Week
The holiday-shortened week was a good one for stocks. All of the major indices moved higher. Small-caps and tech stocks were the best performers.

Economic Data
Industrial production and jobless claims were better-than-expected. On the downside, housing starts and the Empire State Manufacturing Survey were worse-than-expected.

TSP Funds
The S Fund led the way with a 4.2% gain. The I followed, advancing 3.23%. The C Fund rose by 2.91%. After falling last week, the F Fund moved up by 0.15%.

System Allocations

TSP Standard    BTD          LR
50% G & 50% S 100% G 75% G & 25% C


BTD = Buy the Dip
LR = Low Risk
New Trades: none
See description of systems here

TSP Fund Performance (2/19/2016 YTD)

G Fund F Fund C Fund S Fund I Fund
0.29% 2.01% -5.84% -10.60% -8.45%


System Performance (2/19/2016 YTD)

Standard  BTD   LR
-9.56% 0.29% -3.46%

Charts
1.  Daily S&P 500 (C Fund Proxy)

2.  Daily EFA (I Fund Proxy)

3.  Daily Wilshire 4500 (S Fund Proxy)

4.  Daily AGG (F Fund Proxy)

Get The Full Picture

Weekly Wrap Up

From Briefing.com
Newsletter 2/12/16

Quick Recap of the Week
After dropping sharply most of the week, stocks had a strong rally on Friday. For the week, the major indices closed with modest losses.

Economic Data
On the positive side, retail sales and jobless claims were better-than-expected. However, consumer sentiment fell while business inventories rose (not a good sign).

TSP Funds
The F Fund had the week’s only gain of 0.17%. The C Fund fell 0.72% while the S Fund decreased by 1.96%. The I Fund had the biggest loss of 3.60%.

System Allocations

TSP Standard    BTD          LR
50% G & 50% S 100% G 75% G & 25% C


BTD = Buy the Dip
LR = Low Risk
New Trades: none
See description of systems here

TSP Fund Performance (2/12/2016 YTD)

G Fund F Fund C Fund S Fund I Fund
0.25% 1.86% -8.50% -14.19% -11.31%


System Performance (2/12/2016 YTD)

Standard  BTD   LR
-11.41% 0.25% -4.18%

Charts
1.  Daily S&P 500 (C Fund Proxy)

2.  Daily EFA (I Fund Proxy)

3.  Daily Wilshire 4500 (S Fund Proxy)

4.  Daily AGG (F Fund Proxy)

Get The Full Picture

Weekly Wrap Up

From Briefing.com