Tag Archives: TSP Funds

Newsletter 11/5/15

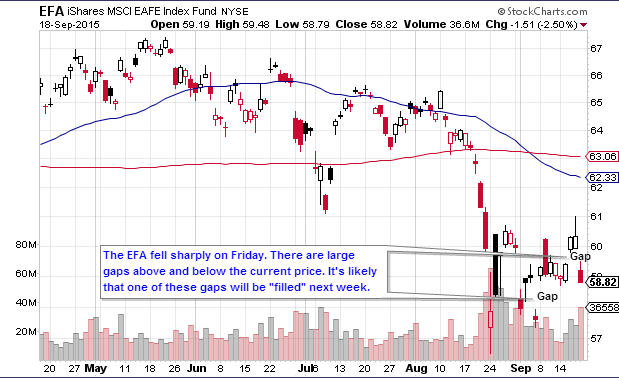
Quick Recap of the Week

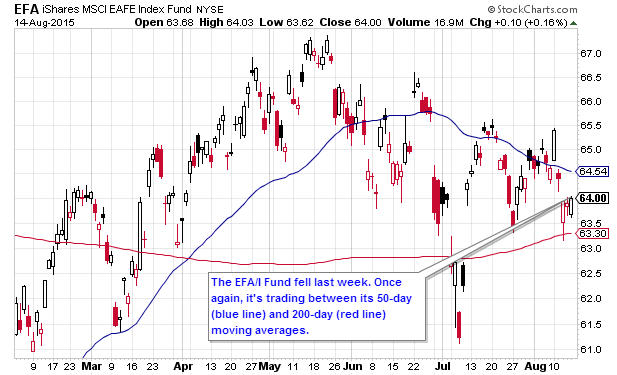
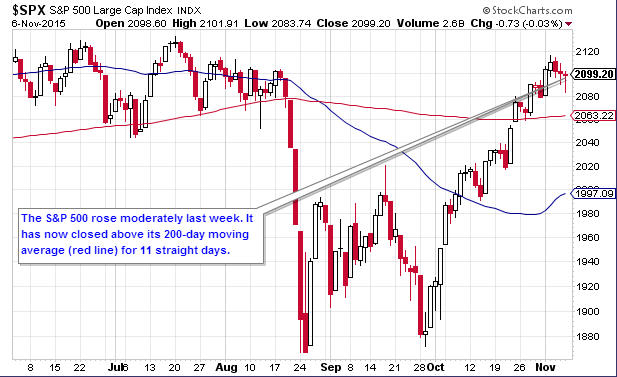
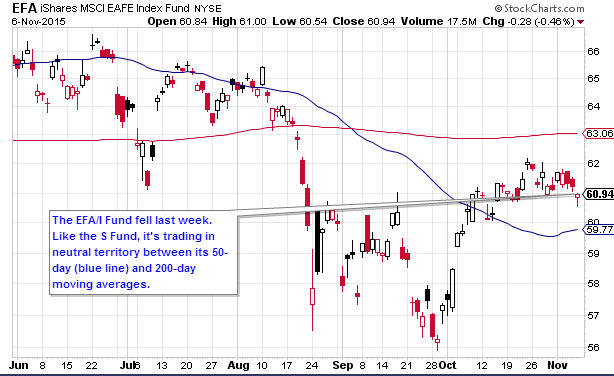
It was a choppy week for the stock market. In the U.S., stocks moved up, but a rising U.S. dollar hurt international markets.

Economic data was mostly positive. The monthly employment numbers were better-than-expected. So was construction spending and the ISM non-manufacturing index. The ISM manufacturing index came in below expectations, however.

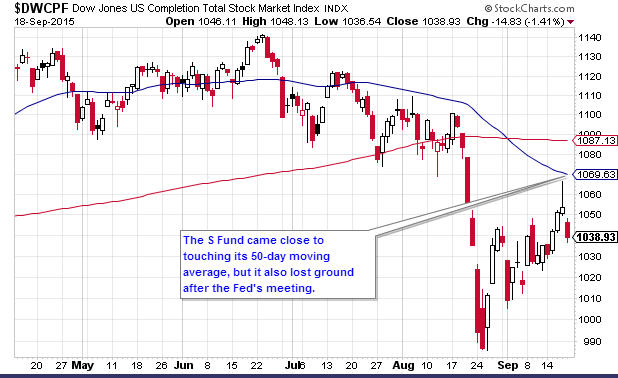
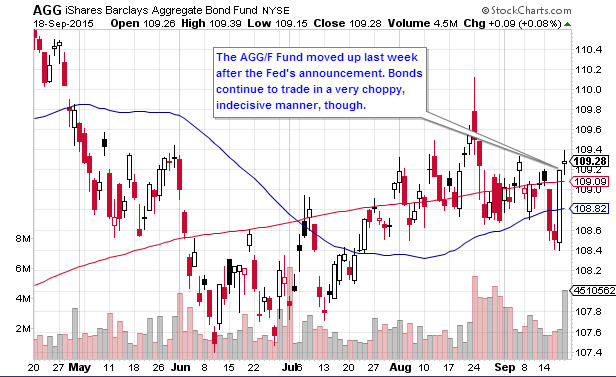
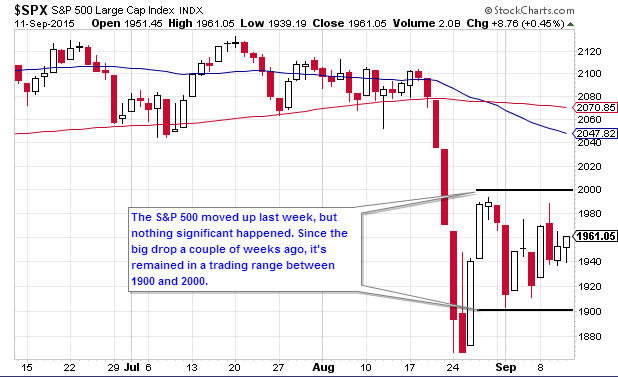
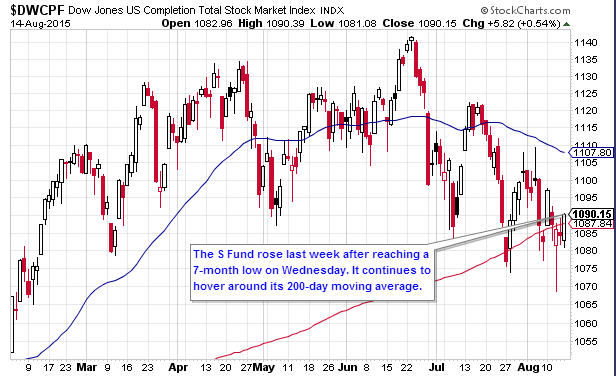
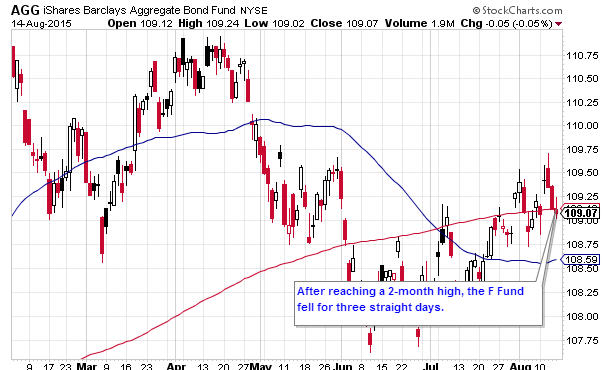
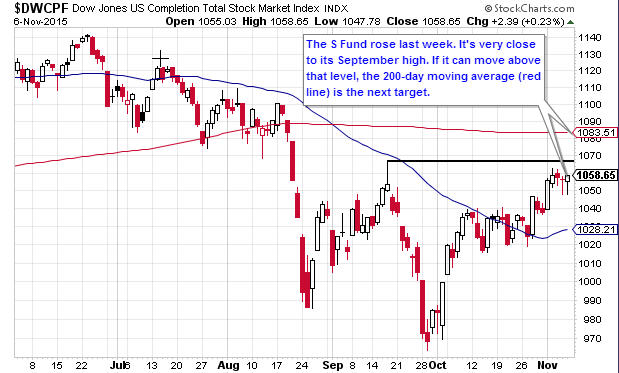
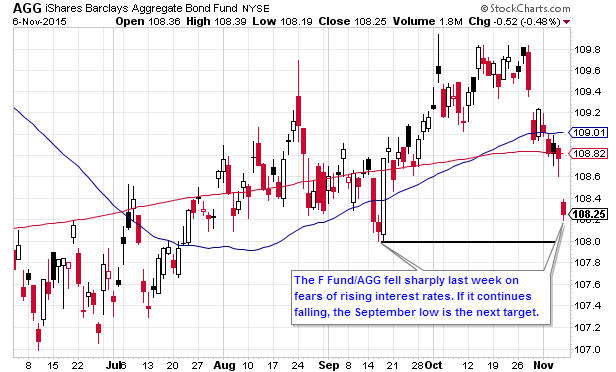
The S Fund was the best performer, advancing 2.07%. The C Fund followed with a 1.03% gain. Fear of rising interest rates hurt the F and I Funds. The F fell by 0.80% while the I Fund declined by 0.86%.

YTD Return as of 11/5/15: -10.19%
Current allocation: 100% C Fund as of 11/2/15
New Trades: None.

TSP Fund Performance (11/5/2015 YTD)

G Fund F Fund C Fund S Fund I Fund
1.72% 0.65% 3.82% 1.34% 1.55%

Charts
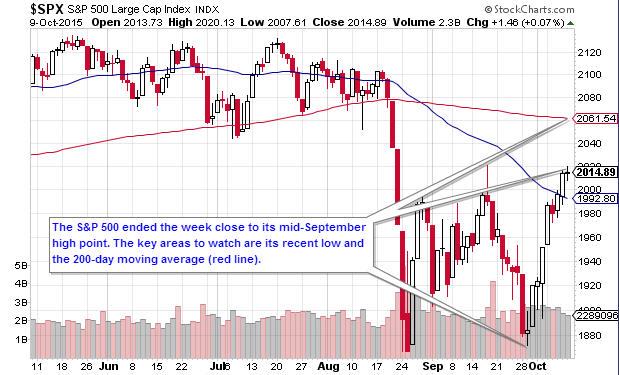
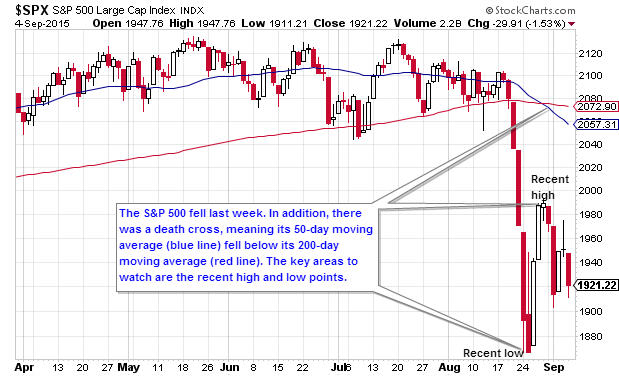
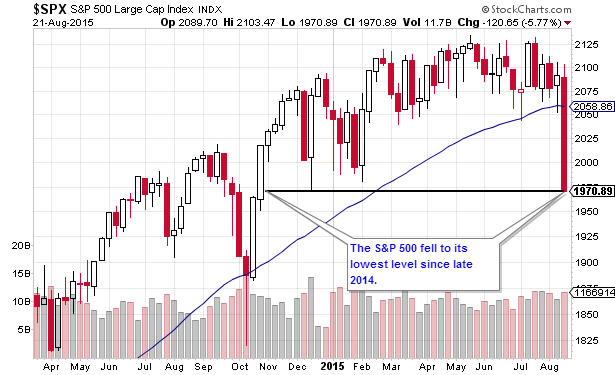
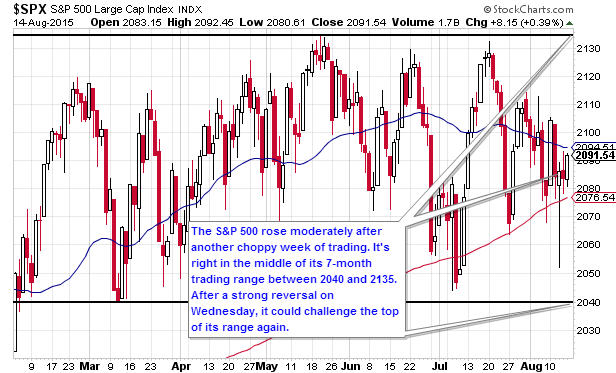
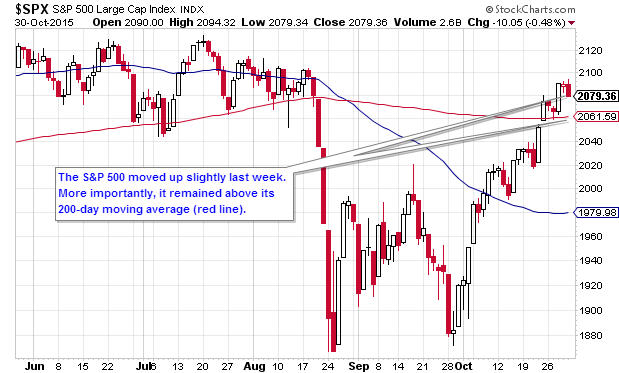
1.  Daily S&P 500 (C Fund Proxy)

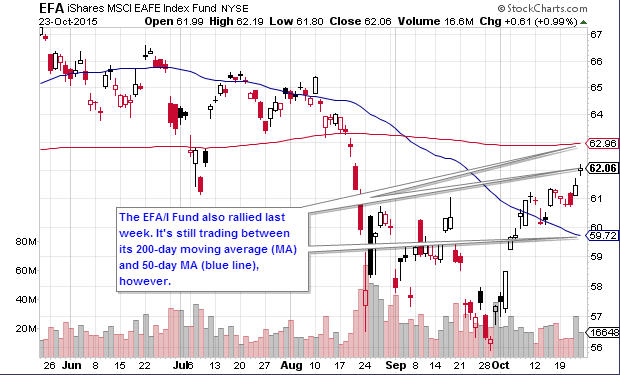
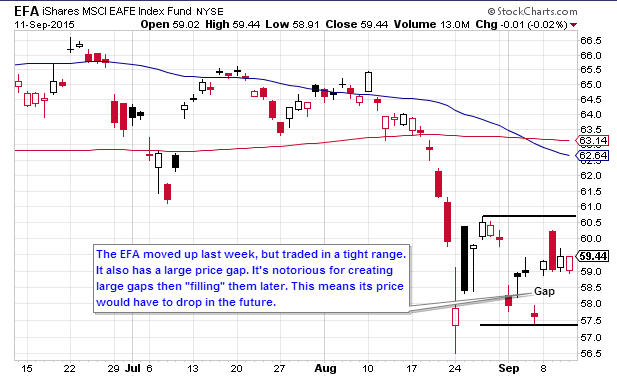
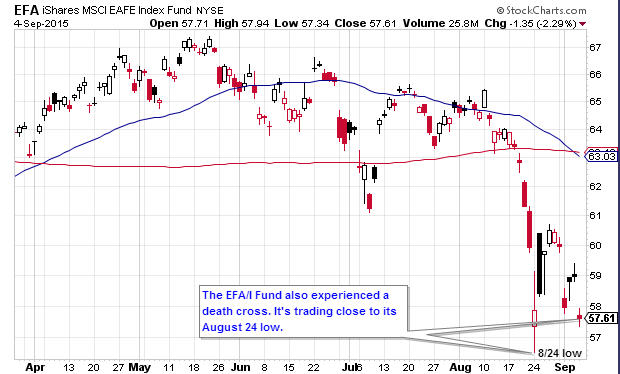
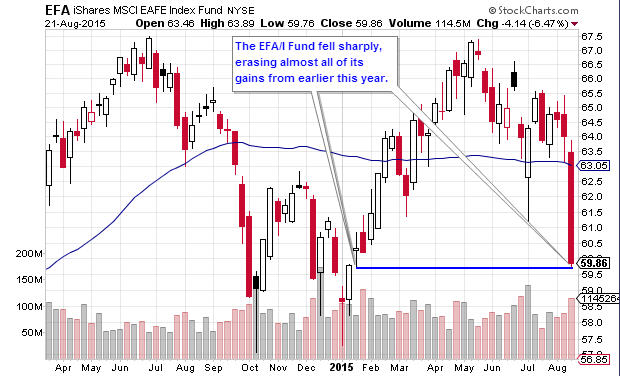
2.  Daily EFA (I Fund Proxy)

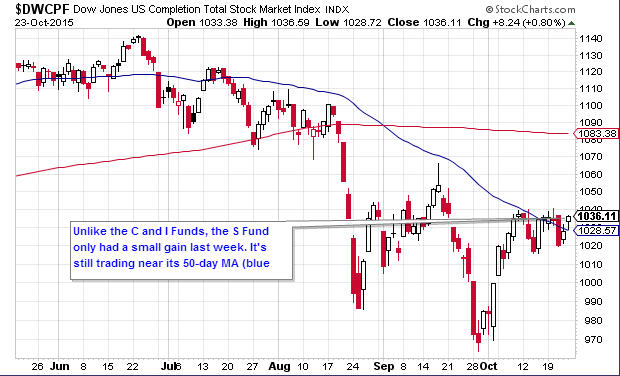
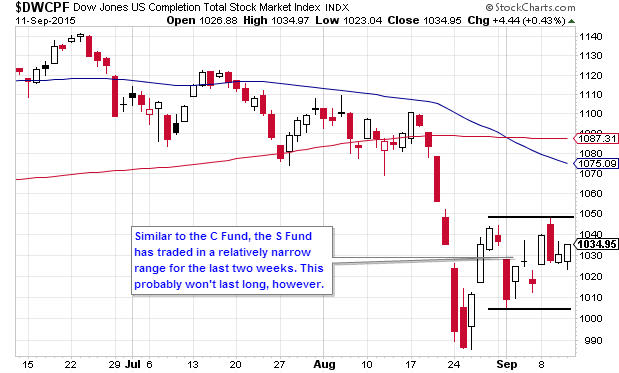
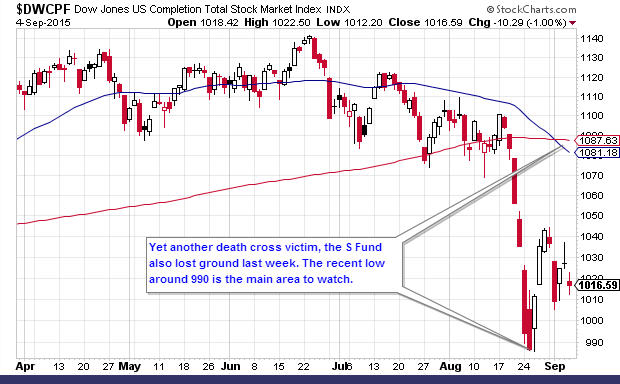
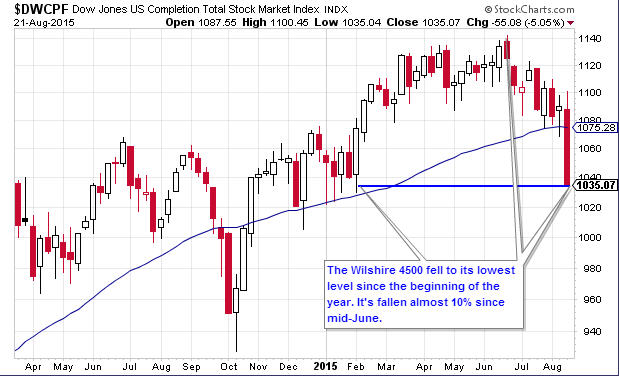
3.  Daily Wilshire 4500 (S Fund Proxy)

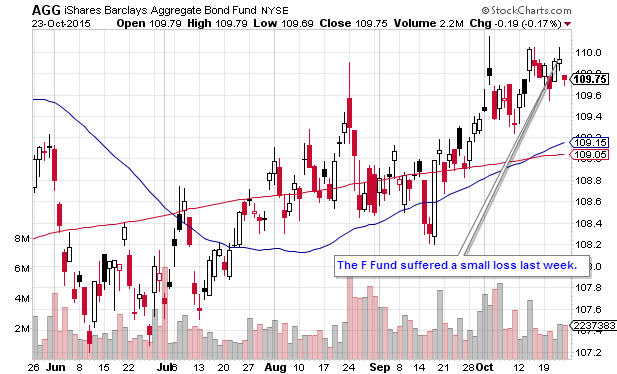
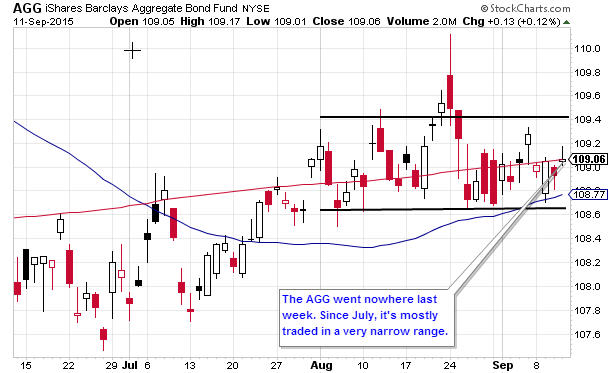
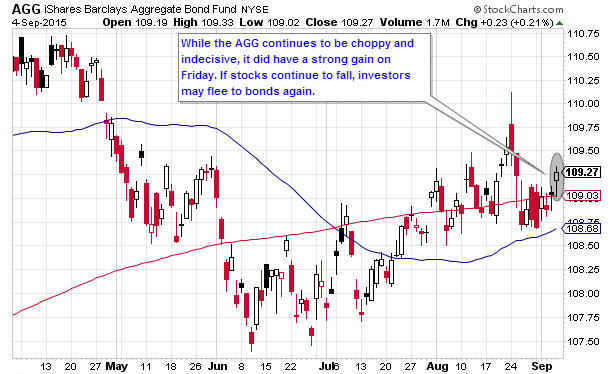
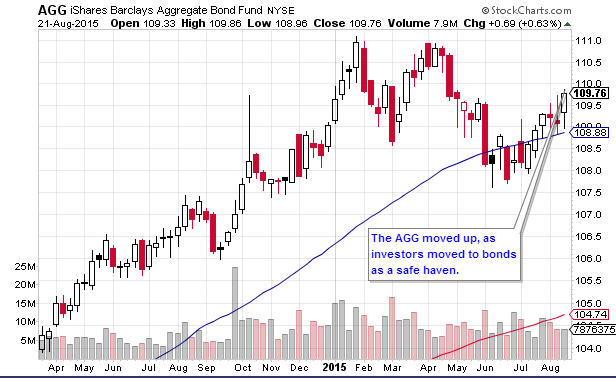
4.  Daily AGG (F Fund Proxy)

Get The Full Picture

Weekly Wrap Up

From Briefing.com
Newsletter 10/30/15

Quick Recap of the Week

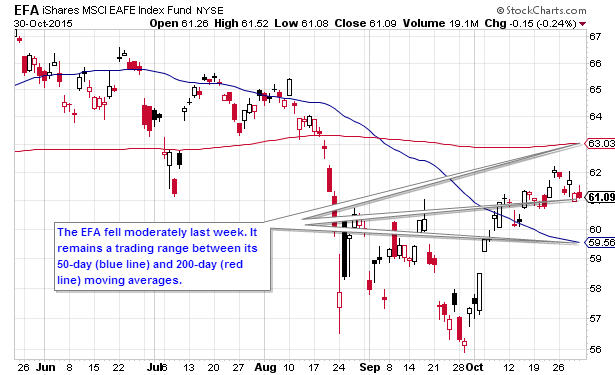
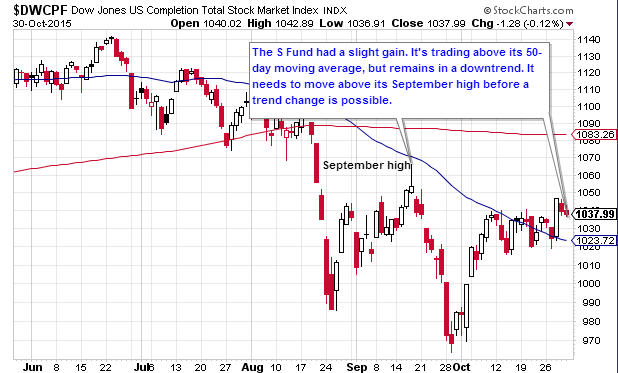
Stocks rose slightly last week. Once again, the major indexes (S&P 500, Dow, Nasdaq) performed better than small-cap stocks.

As for economic data, both the Chicago purchasing managers index and inital jobless claims were better-than-expected. On the negative side, consumer confidence, consumer sentiment and the gross domestic product were below expectations.

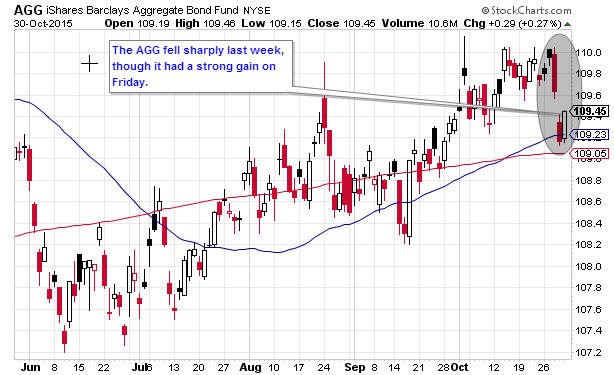
As for the TSP Funds, the C moved up 0.23% while the S advanced by 0.21%. The F Fund fell by 0.30% while the I Fund dropped 0.98%.

  • YTD Return as of 10/30/15: -10.59%
  • Current allocation: 100% C Fund as of 11/2/15
  • New Trades: IFT to 100% C Fund before noon EST on 11/2/2015

TSP Fund Performance (10/30/2015 YTD)

G Fund F Fund C Fund S Fund I Fund
1.68% 1.46% 2.76% -0.71% 2.43%

Charts

1.  Daily S&P 500 (C Fund Proxy)

2.  Daily EFA (I Fund Proxy)

3.  Daily Wilshire 4500 (S Fund Proxy)

4.  Daily AGG (F Fund Proxy)

Get The Full Picture

Weekly Wrap Up

From Briefing.com
Newsletter 10/24/2015

Quick Recap of the Week

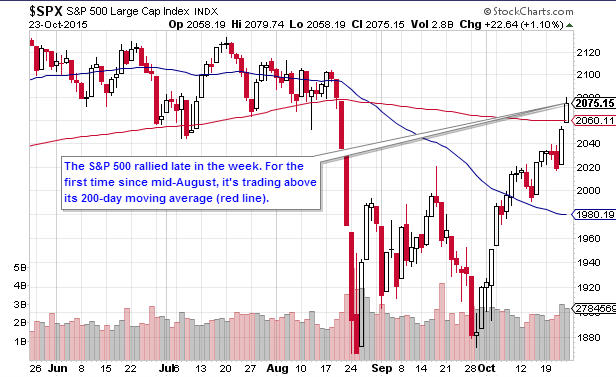
After struggling early in the week, stocks rallied on Thursday and Friday. Gains were limited for small-cap stocks, but larger stocks performed well.

Economic Data
Initial jobless claims and home sales were better-than-expected. So was the manufacturing purchasing index.

TSP Funds
The C Fund had week’s largest gain of 2.09%. The I Fund advanced by 0.84% while the S Fund moved up 0.20%. The F Fund had a 0.08% loss.

  • YTD Return as of 10/23/15: -10.71%
  • Current allocation: 50% C Fund and 50% G Fund as of 10/16/15
  • New Trades: None.

TSP Fund Performance (10/23/2015 YTD)

G Fund F Fund C Fund S Fund I Fund
1.64% 1.76% 2.53% -0.92% 3.45%

Charts

1.  Daily S&P 500 (C Fund Proxy)

2.  Daily EFA (I Fund Proxy)

3.  Daily Wilshire 4500 (S Fund Proxy)

4.  Daily AGG (F Fund Proxy)

Get The Full Picture

Weekly Wrap Up

From Briefing.com
Newsletter 10/9/15

Quick Recap of the Week

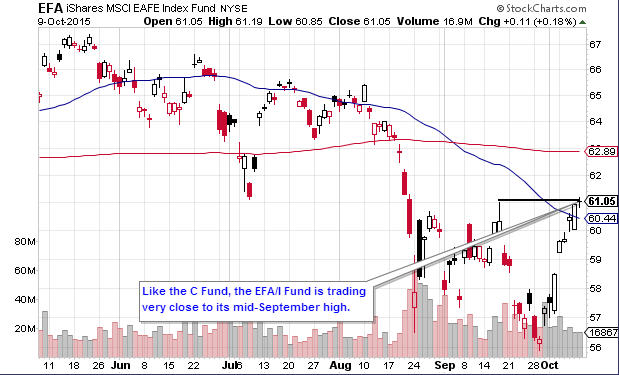
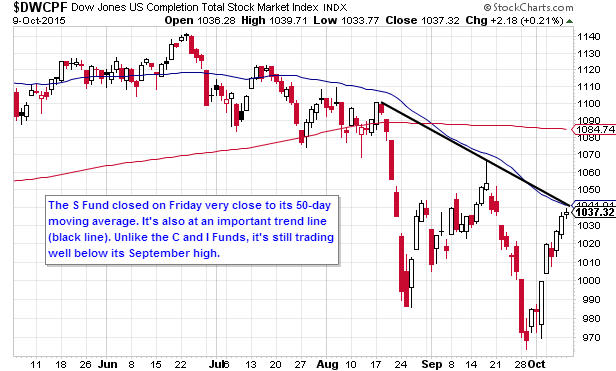
Stocks rose last week. Several indexes, including the S&P 500, ended the week near their September highs.

As for economic data, initial jobless claims and housing data were better-than-expected. On the negative side, the ISM services index was below its forecast while the U.S. trade deficit widened.

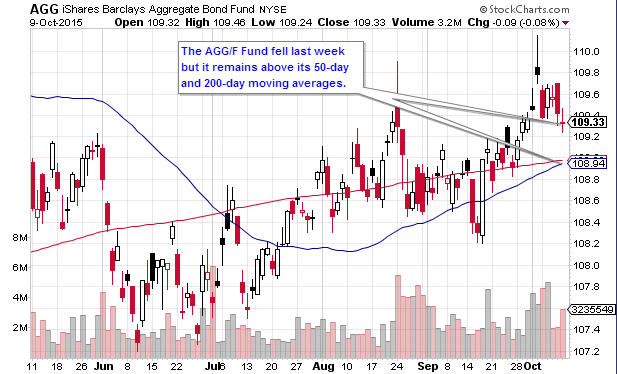
The I Fund had the largest gain of 4.80%. The S and C Fund followed, with gains of 3.83% and 3.31%, respectively. The F Fund fell by 0.24%.

  • YTD Return as of 10/9/15: -11.69%
  • Current allocation: 50% C Fund and 50% G Fund as of 10/16/15
  • New Trades: IFT to 50% C Fund and 50% G Fund before noon EST on Friday, 10/16/2015.

TSP Fund Performance (10/9/2015 YTD)

G Fund F Fund C Fund S Fund I Fund
1.56% 1.48 -0.49% -0.88% 2.29%

Charts

1.  Daily S&P 500 (C Fund Proxy)

2.  Daily EFA (I Fund Proxy)

3.  Daily Wilshire 4500 (S Fund Proxy)

4.  Daily AGG (F Fund Proxy)

Get The Full Picture

Weekly Wrap Up

From Briefing.com
Newsletter 9/25/15

Quick Recap of the Week

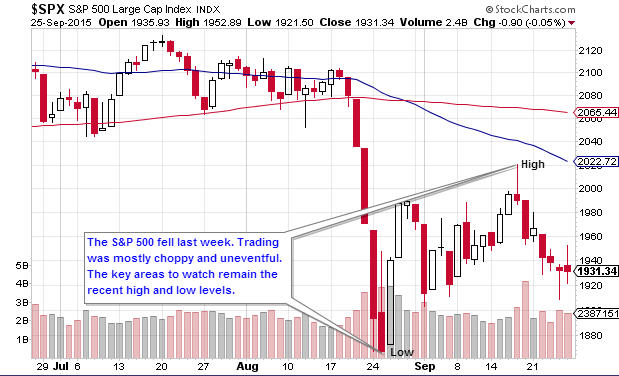
Stocks fell again last week. Losses were modest for larger “blue chip” stocks. However, small-cap and technology stocks had much larger losses. Biotech stocks were hit the hardest, as the sector dropped almost 16%.

As usual, economic data was mixed, but most of it was negative. Consumer confidence and several manufacturing indexes were worse-than-expected. Japan, China and the UK all had economic weak data, too. On the positive side, new home sales and initial jobless claims were better than their forecasts.

For the TSP, the S Fund had the bigget loss of 3.20%. The I Fund fell 1.97%, while the C Fund declined by 1.36%. Surprisingly, the F Fund also had a small loss of 0.24%. Investors didn’t flee to bonds as they have in previous weeks.

  • YTD Return as of 9/25/15: -11.75%
  • Current allocation: 100% G Fund as of 9/1/15
  • New Trades: None.

TSP Fund Performance (9/25/2015 YTD)

G Fund F Fund C Fund S Fund I Fund
1.48% 1.03% -4.72% -4.14% -3.56%

Charts

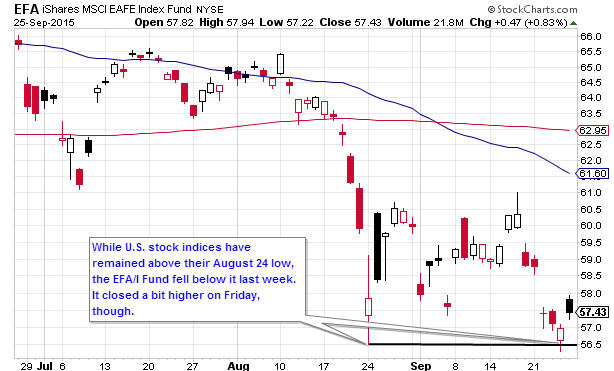
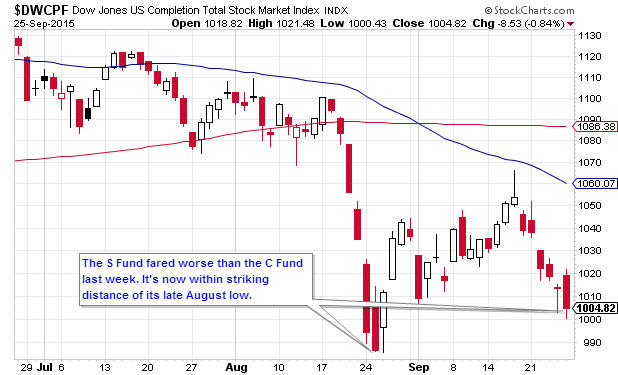
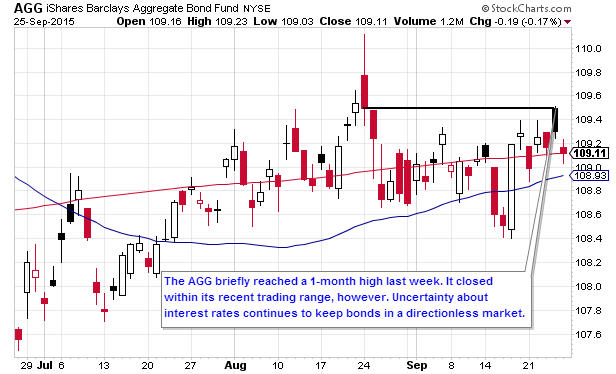
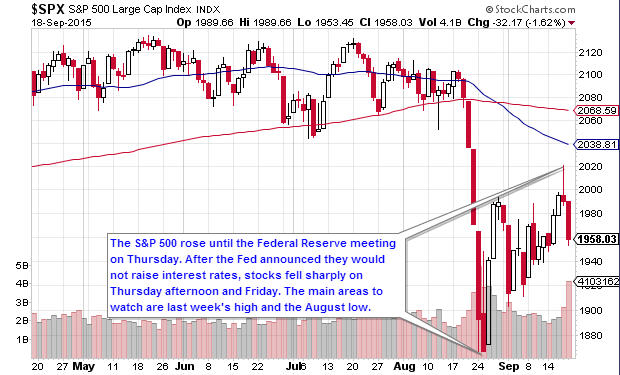
1.  Daily S&P 500 (C Fund Proxy)

2.  Daily EFA (I Fund Proxy)

3.  Daily Wilshire 4500 (S Fund Proxy)

4.  Daily AGG (F Fund Proxy)

Get The Full Picture

Weekly Wrap Up

From Briefing.com
Newsletter 9/18/15

Quick Recap of the Week

The markets

Stocks had mixed results last week. As expected, everything revolved around the Federal Reserve’s meeting. After dropping modestly on Monday, stocks moved up before the meeting. However, it was a classic “buy the rumor, sell the news” event.

The Fed left rates unchanged. After some volatile trading, most stock indices closed slightly lower for the day. This was followed by a larger drop on Friday.

Economic data

Housing permits and jobless claims were better than expected. Retail sales, housing starts and the Philly Fed Index came in below expectations.

TSP funds

The F Fund moved up by 0.35% as stock investors fled to bonds late in the week. The S Fund advanced by 0.34%, holding on to a small gain after Friday’s downturn. The C Fund fell 0.12% while the I Fund declined by 1.09%.

  • YTD Return as of 9/18/15: -11.79%
  • Current allocation: 100% G Fund as of 9/1/15
  • New Trades: None.

TSP Fund Performance (9/18/2015 YTD)

G Fund F Fund C Fund S Fund I Fund
1.44% 1.27 -3.41% -0.97% -1.62%

Charts

1.  Daily S&P 500 (C Fund Proxy)

2.  Daily EFA (I Fund Proxy)

3.  Daily Wilshire 4500 (S Fund Proxy)

4.  Daily AGG (F Fund Proxy)

Get The Full Picture

Weekly Wrap Up

From Briefing.com
Newsletter 9/11/15

Quick Recap of the Week

Stocks moved up modestly in a holiday-shortened trading week. They began the week by opening higher on Tuesday. After that, it was mostly choppy, back-and-forth action.

Economic data was mixed. Weekly jobless claims and the Fed’s Labor Market Conditions Index were better-than-expected. Consumer sentiment and wholesale inventories came in below expectations.

As for the TSP, the I Fund moved up 2.61%. The C Fund gained 2.13%, while the S Fund advanced by 1.87%. The F Fund fell by 0.11%.

  • YTD Return as of 9/11/15: -11.83%
  • Current allocation: 100% G Fund as of 9/1/15
  • New Trades: None.

TSP Fund Performance (9/11/2015 YTD)

G Fund F Fund C Fund S Fund I Fund
1.40% 0.92% -3.30% -1.31% -0.54%

Charts

1.  Daily S&P 500 (C Fund Proxy)

2.  Daily EFA (I Fund Proxy)

3.  Daily Wilshire 4500 (S Fund Proxy)

4.  Daily AGG (F Fund Proxy)

Get The Full Picture

Weekly Wrap Up

From Briefing.com
Newsletter 9/4/2015

Quick Recap of the Week

It was another wild week for the financial markets. Stocks fell, but were a bit less volatile than the previous week.

As for economic data, the employment change, retail sales and consumer sentiment were worse-than-expected. Initial jobless claims were better than their forecast, however.

As for the TSP funds, the I Fund had the largest loss of 4.37%. The C Fund fell 3.36% while the S Fund declined by 2.48%. The F Fund rose 0.29%.

  • YTD Return as of 9/4/15: -11.86%
  • Current allocation: 100% G Fund as of 9/1/15
  • New Trades: None.

TSP Fund Performance (9/4/2015 YTD)

G Fund F Fund C Fund S Fund I Fund
1.36% 1.03 -5.32% -3.12% -3.06%

Charts

1.  Daily S&P 500 (C Fund Proxy)

2.  Daily EFA (I Fund Proxy)

3.  Daily Wilshire 4500 (S Fund Proxy)

4.  Daily AGG (F Fund Proxy)

Get The Full Picture

Weekly Wrap Up

From Briefing.com
Newsletter 8/21/15

Quick Recap of the Week

The stock market fell hard last week. Global economic concerns were the main driver. China’s stock market continued to drop. Several events in Greece also caused concern.

Despite this, there was some encouraging economic data. Both housing starts and refinance applications were better-than-expected. The Philly Fed Index also came in above its forecast. On the flip side, several manufacturing indexes had worse-than-expected results.

The Federal Reserve also released their July minutes. The Fed committee remains divided on whether they should increase interest rates later this year. The minutes implied they would probably increase rates in September or December. However, stock market volatility and economic concerns could change their minds.

As for the TSP Funds, the C, S and I Funds all fell around 5%. The F Fund increased by 0.60%.

  • YTD Return as of 8/21/15: -9.30%
  • Current allocation: 100% C Fund as of 8/3/15
  • New Trades: None.

TSP Fund Performance (8/21/2015 YTD)

G Fund F Fund C Fund S Fund I Fund
1.27% 1.33 -2.95% 1.43% 1.01%

Charts

1.  Daily S&P 500 (C Fund Proxy)

2.  Daily EFA (I Fund Proxy)

3.  Daily Wilshire 4500 (S Fund Proxy)

4.  Daily AGG (F Fund Proxy)

Get The Full Picture

Weekly Wrap Up

From Briefing.com
Newsletter 8/14/15

Quick Recap of the Week

Stocks moved up slightly last week, despite a mid-week scare. China’s currency fell sharply on Tuesday and Wednesday, sparking fears in global markets. The U.S. markets managed to recover, however.

As for the TSP, the C and S Funds both had gains of 0.73%. The F Fund fell 0.14%, while the I Fund dropped 1.36%.

  • YTD Return as of 8/14/15: -3.81%
  • Current allocation: 100% C Fund as of 8/3/15
  • New Trades: None.

TSP Fund Performance (8/14/2015 YTD)

G Fund F Fund C Fund S Fund I Fund
1.23% 0.73 2.93% 3.76% 6.67%

Charts

1.  Daily S&P 500 (C Fund Proxy)

2.  Daily EFA (I Fund Proxy)

3.  Daily Wilshire 4500 (S Fund Proxy)

4.  Daily AGG (F Fund Proxy)

Get The Full Picture

Weekly Wrap Up

From Briefing.com