Tag Archives: TSP Funds

Newsletter 2/5/16

Quick Recap of the Week
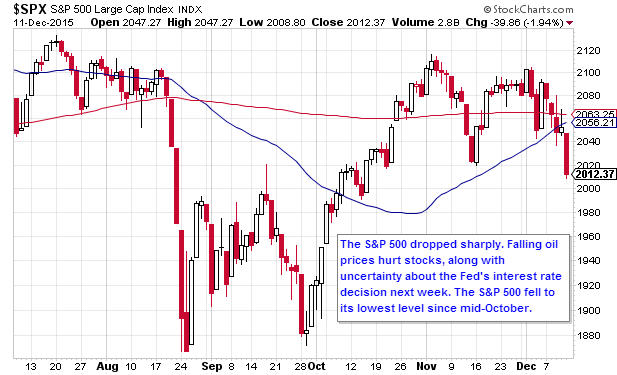
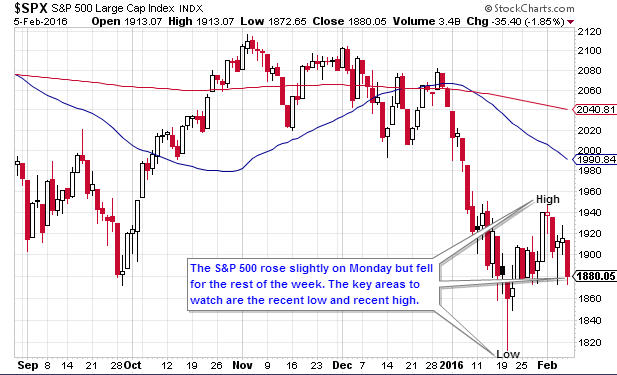
After rising for two straight weeks, stocks fell. Falling oil prices and weakness in the tech sector were the main causes. The major indices fell between 1.6% (Dow) and 5.4% (Nasdaq).

Economic Data
On the positive side, the unemployment rate fell while the PMI Manufacturing Index rose. However, factory orders declined, along with the ISM manufacturing and service indices. In addition, jobless claims rose while the non-farm employment change was negative. Overall, the data didn’t paint a pretty picture.

TSP Funds
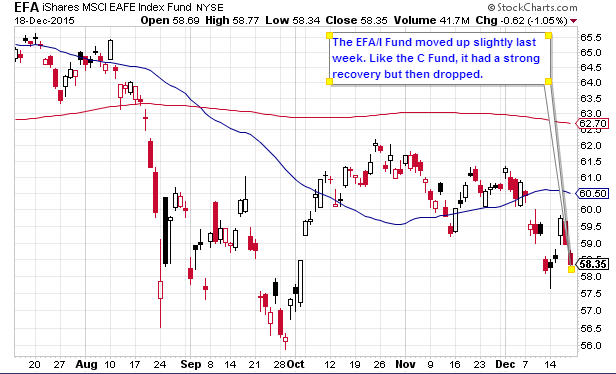
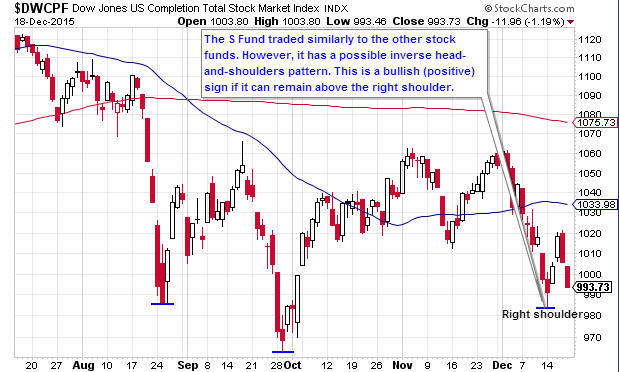
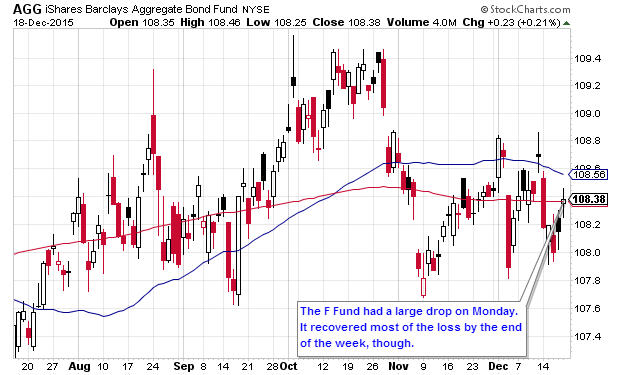
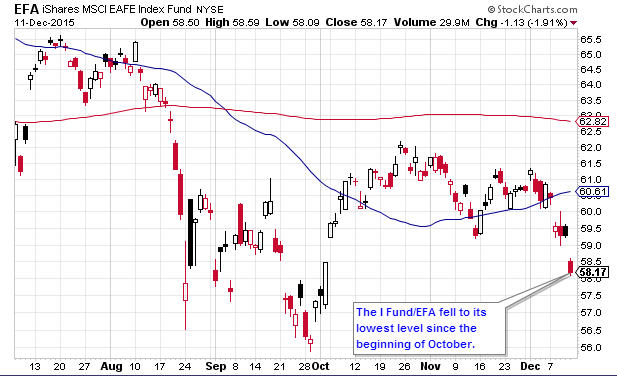
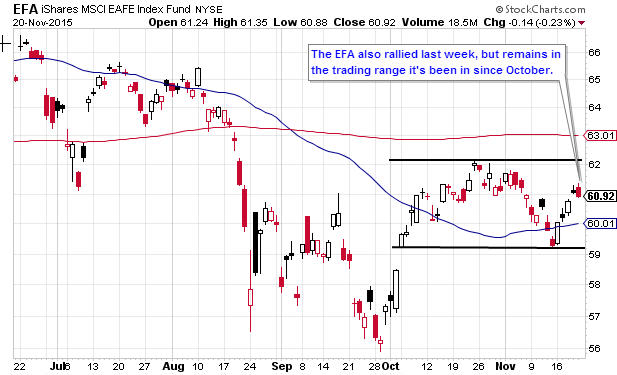
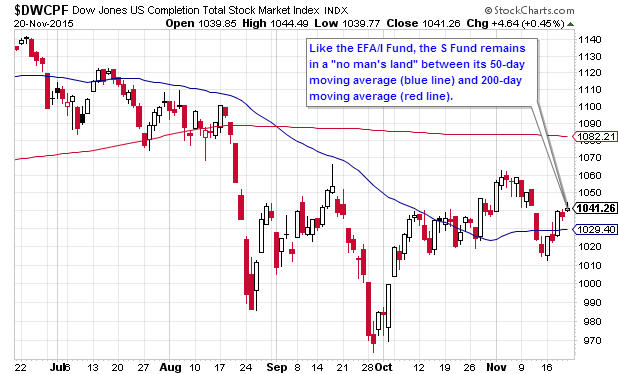
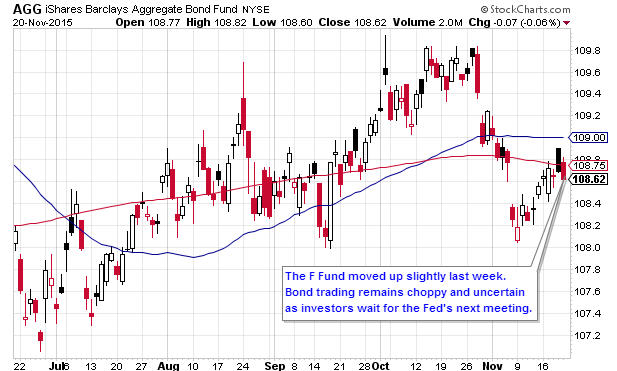
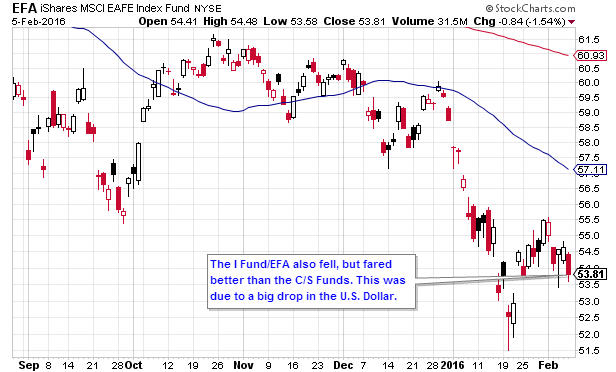
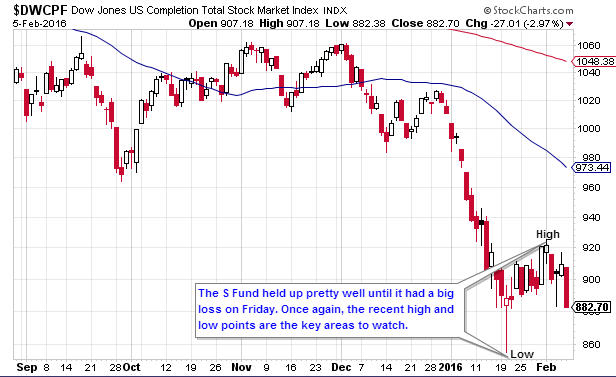
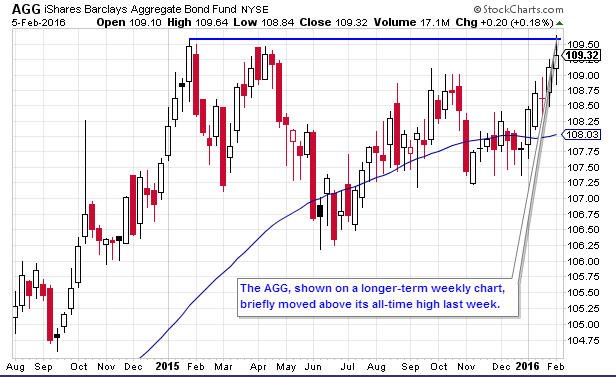
The S Fund fell 4.11% while the C Fund dropped 3.03%. Thanks to a falling U.S. Dollar, the I Fund had a smaller loss of 2.52%. The F Fund gained 0.20%.

System Allocations

TSP Standard    BTD          LR
50% G & 50% S 100% G 75% G & 25% C


New Trades: none

See description of systems here

TSP Fund Performance (2/5/2016 YTD)

G Fund F Fund C Fund S Fund I Fund
0.22% 1.69% -7.84% -12.48% -8.00%


System Performance (2/5/2016 YTD)

Standard  BTD   LR
-10.57% 0.22% -4.04%

Charts
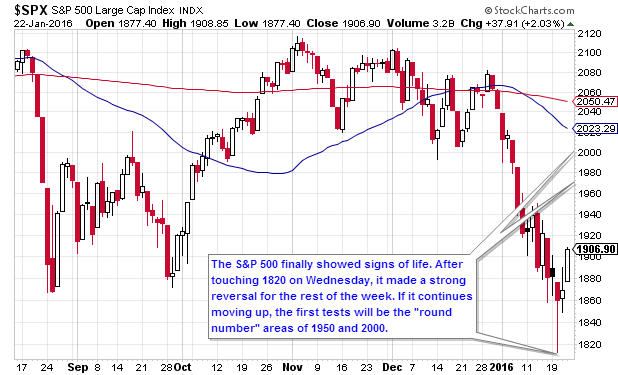
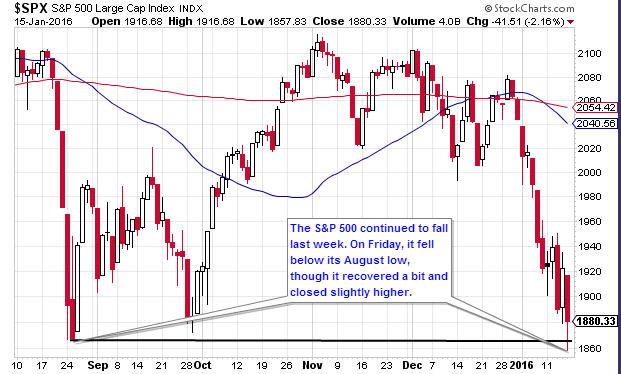
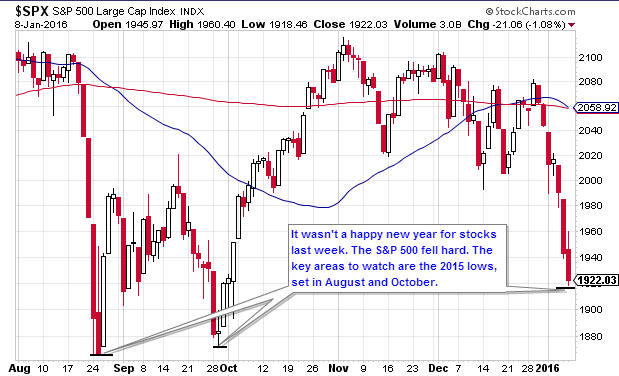
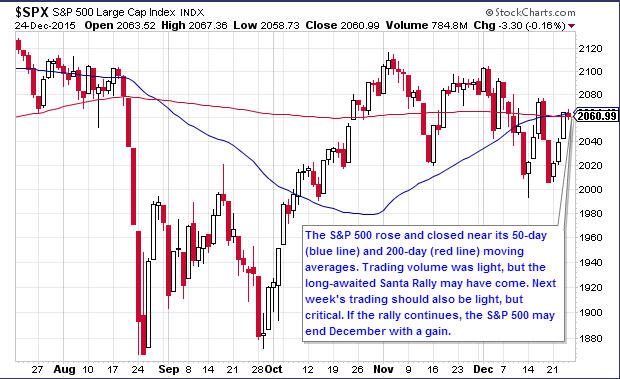
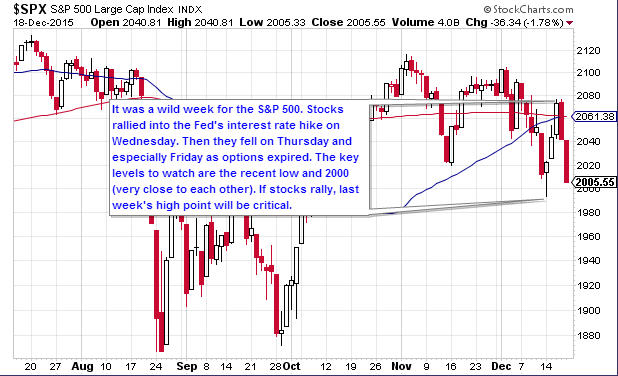
1.  Daily S&P 500 (C Fund Proxy)

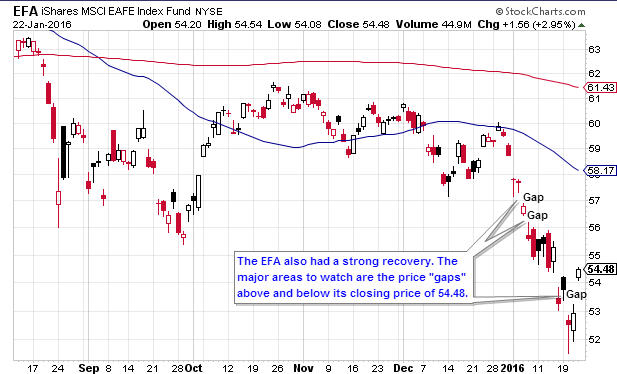
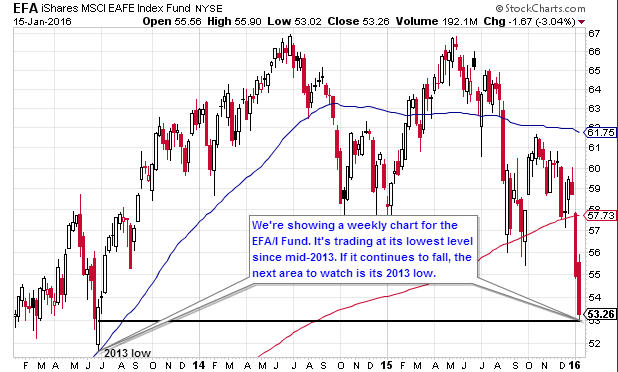
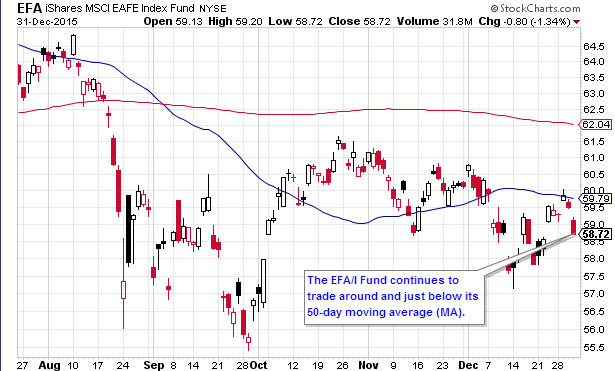
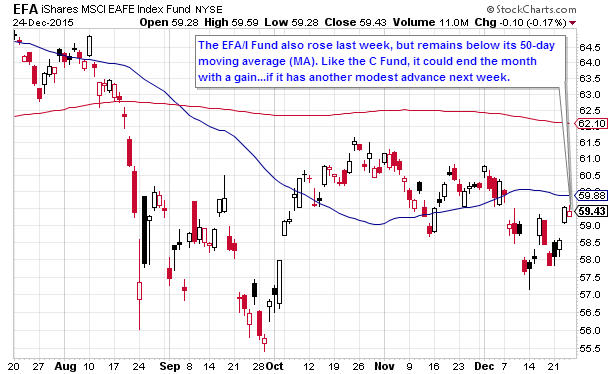
2.  Daily EFA (I Fund Proxy)

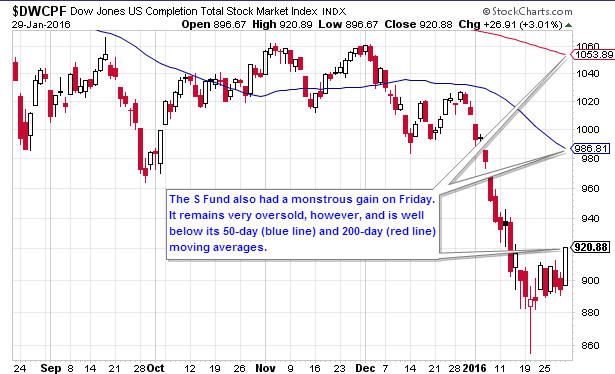
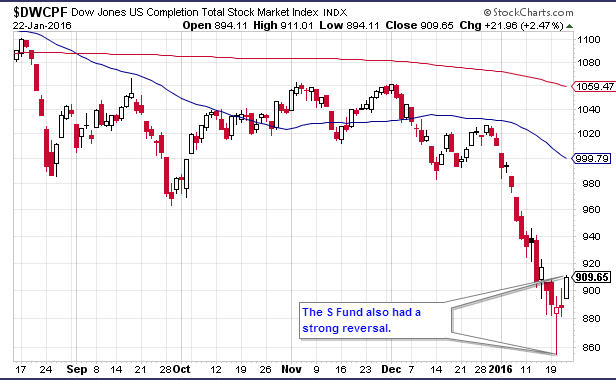
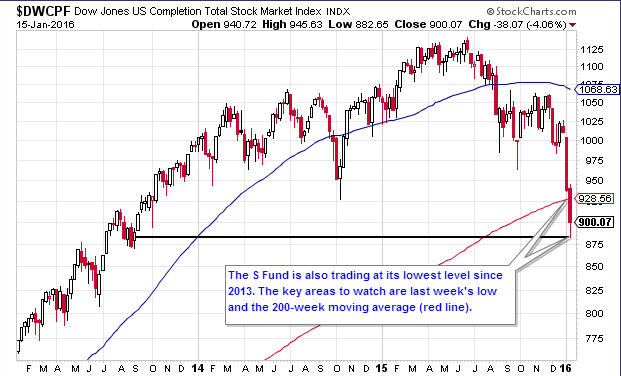
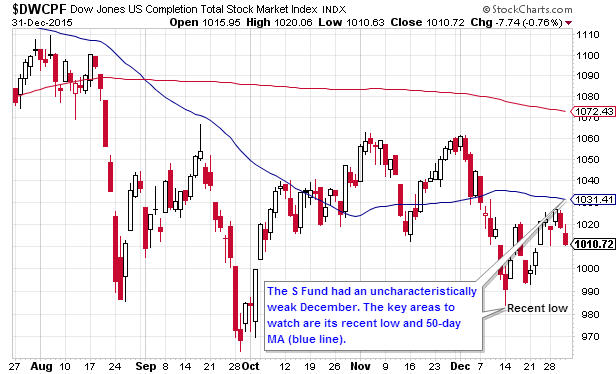
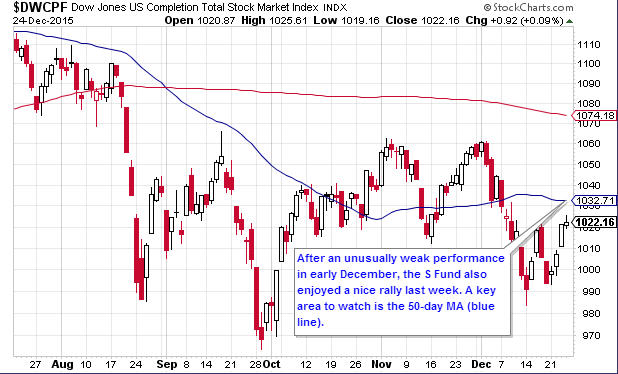
3.  Daily Wilshire 4500 (S Fund Proxy)

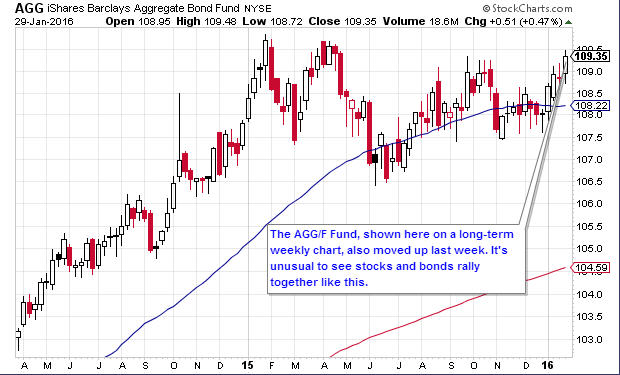
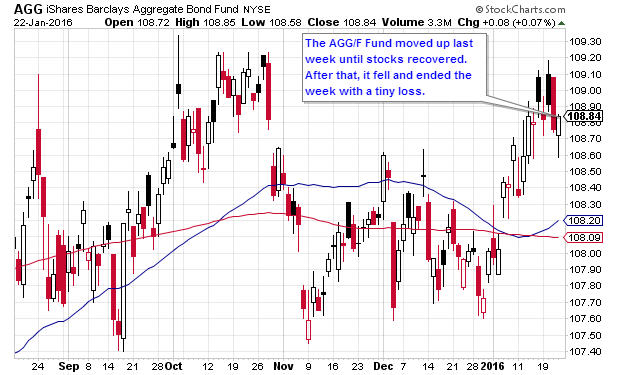
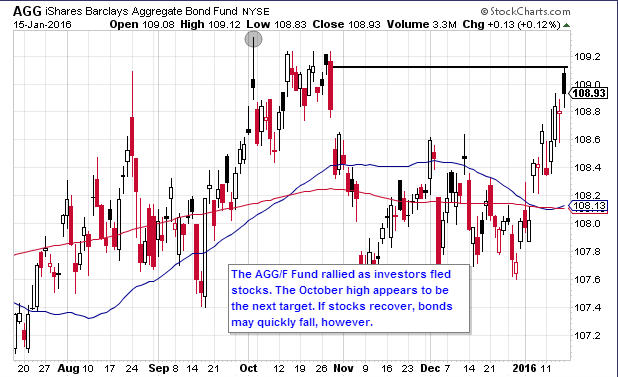
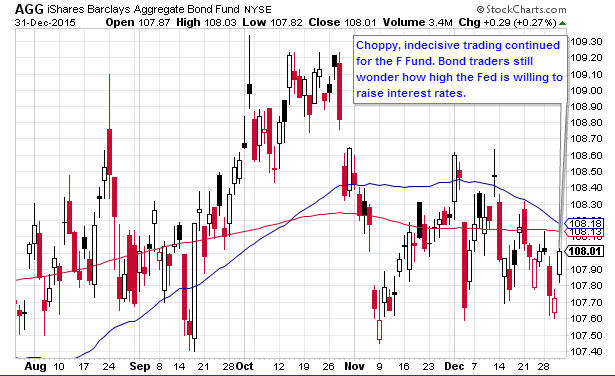
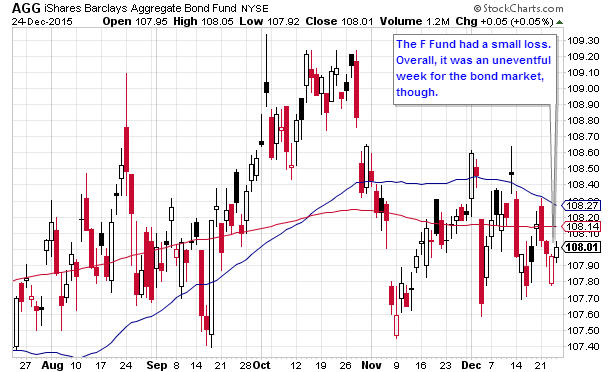
4.  Daily AGG (F Fund Proxy)

Get The Full Picture

Weekly Wrap Up

From Briefing.com
Newsletter 1/29/16

Quick Recap of the Week
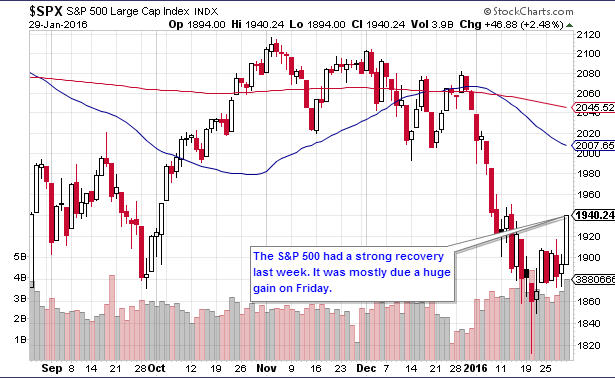
Stocks moved up for a second straight week. The market digested a slew of data releases and corporate earnings reports. In addition, the Federal Reserve released their latest statement. The Fed said four interest rate hikes may still be on the table this year.

The Bank of Japan, on the other hand, introduced negative interest rates. International markets rallied. This spread to the U.S., where stocks had a massive gain on Friday.

Economic Data
As mentioned, there were many economic data releases last week. Among those with better-than-expected results were the Chicago purchasing managers index, jobless claims, new home sales and home prices. Coming in below expectations were gross domestic product, durable goods orders, pending home sales and the U.S. services index. Overall, it was a very mixed bag.

TSP Funds
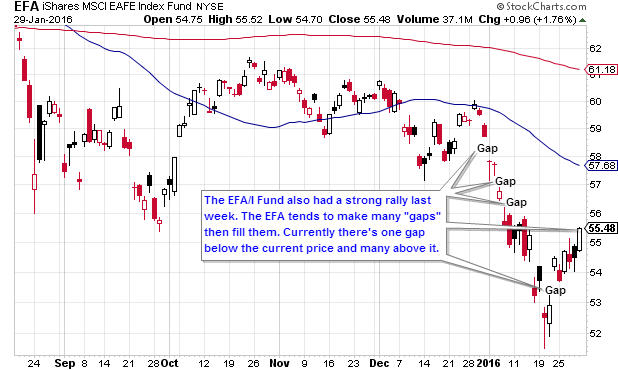
In a rare occurrence, all of the TSP funds moved up last week. The I Fund was the top performer with a 2.55% gain. The C followed, advancing 1.77%, followed by the S Fund with a 1.29% gain. The F Fund rose by 0.59%.

Systems

TSPKey Standard
YTD Return as of 1/29/16: -8.72%
Allocation: 50% G Fund and 50% S Fund
New Trades: Interfund transfer (IFT) and new contribution allocation to 50% G Fund and 50% S Fund before noon EST on 2/1/16

TSPKey BTD (Buy the Dip)
YTD Return as of 1/15/16: 0.19%
Allocation: 100% G Fund
New Trades: None

TSPKey LR (Low Risk)
YTD Return as of 1/15/16: -3.34%
Allocation: 75% G Fund and 25% C Fund
New Trades: IFT and new contribution allocation to 75% G Fund and 25% C Fund before noon EST on 2/1/16

.

TSP Fund Performance (12/4/2015 YTD)

G Fund F Fund C Fund S Fund I Fund
0.19% 1.49% -4.96% -8.72% -5.62%

Charts
1.  Daily S&P 500 (C Fund Proxy)

2.  Daily EFA (I Fund Proxy)

3.  Daily Wilshire 4500 (S Fund Proxy)

4.  Daily AGG (F Fund Proxy)

Get The Full Picture

Weekly Wrap Up

From Briefing.com
Newsletter 1/22/2016

Quick Recap of the Week

After a terrible start to 2016, stocks finally had a turnaround. Sellers remained in control until late Wednesday morning, when oil and stocks began to rally. All of the major stock indexes finished positive for the week.

Economic Data

Existing home sales and manufacturing PMI moved up on a month-over-month basis. Housing starts, housing permits and jobless claims were worse-than-expected.

TSP Funds

The C Fund led the TSP with a 1.43% gain. It was followed by the I and S Funds with 1.24% and 1.10% gains, respectively. The F Fund fell -0.11.

Systems

TSPKey (Standard)
YTD Return as of 1/15/16: -9.89%
Allocation: 100% S Fund
New Trades: None

TSPKey BTD (Buy the Dip)
YTD Return as of 1/15/16: 0.13%
Allocation: 100% G Fund
New Trades: None

TSPKey LR (Lower Risk)
YTD Return as of 1/15/16: -4.11%
Allocation: 50% G Fund, 25% C Fund, 25% S Fund
New Trades: None

TSP Fund Performance (1/22/2015 YTD)

G Fund F Fund C Fund S Fund I Fund
0.13% 0.90% -6.61% -9.89% -7.97%

Charts
1.  Daily S&P 500 (C Fund Proxy)

2.  Daily EFA (I Fund Proxy)

3.  Daily Wilshire 4500 (S Fund Proxy)

4.  Daily AGG (F Fund Proxy)

Get The Full Picture

Weekly Wrap Up

From Briefing.com
Newsletter 1/15/2016

Quick Recap of the Week

Stocks fell again last week. As a result, the S&P 500 had its worst-ever 2-week start in January. The only bright side is that stocks are extremely oversold.

Economic Data
Job openings and consumer sentiment were better than expected. Coming in below expectations were the the Empire State Manufacturing survey, retail sales and industrial production.

TSP Funds
The S Fund fell 3.99%, while the C and I Funds fell 2.15% and 2.89%, respectively.

Systems

TSPKey (Standard)
YTD Return as of 1/15/16: -10.87%
Allocation: 100% S Fund
New Trades: None

TSPKey BTD (Buy the Dip)
YTD Return as of 1/15/16: 0.09%
Allocation: 100% G Fund
New Trades: None

TSPKey LR (Lower Risk)
YTD Return as of 1/15/16: -4.74%
Allocation: 50% G Fund, 25% C Fund, 25% S Fund
New Trades: None

TSP Fund Performance (1/15/2015 YTD)

G Fund F Fund C Fund S Fund I Fund
0.09% 1.01% -7.93% -10.87% -9.09%

Charts
1.  Daily S&P 500 (C Fund Proxy)

2.  Daily EFA (I Fund Proxy)

3.  Daily Wilshire 4500 (S Fund Proxy)

4.  Daily AGG (F Fund Proxy)

Get The Full Picture

Weekly Wrap Up

From Briefing.com
Newletter 1/8/2016

Quick Recap of the Week

Stocks fell sharply last week. The main cause was a large drop in the Chinese stock market. Falling oil prices added to the fear.

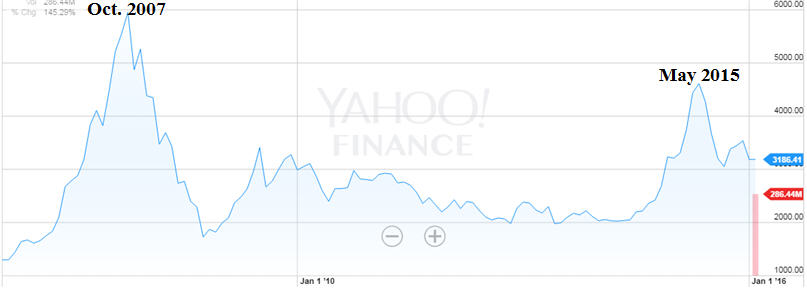
While these are concerns, they aren’t new. The Chinese stock market drop started 6 months ago. In the long term, it’s part of a much bigger correction that began in 2007.

China Stock Market

Likewise, crude oil began to crash in mid-2014. While it’s fallen from almost $110 to under $33/barrel, the S&P 500 is virtually unchanged since that time.

The relationship between oil and stock prices is complex. Low oil and gas prices benefit individuals and businesses, something that’s been downplayed recently. This academic study shows rapidly rising (not falling) oil prices most often lead to stock market declines.

As expected, some are calling for a crash based on recent events. This article gives a more balanced view. At this point, there’s not enough evidence to claim we’re repeating 2008.

Economic Data

On the positive side, several employment indicators were better-than-expected. These included nonfarm payrolls (new jobs) and initial jobless claims.

While employment was strong, manufacturing was weak. The PMI and ISM Manufacturing indexes were worse-than-expected. Factory orders were also down for the month.

TSP Funds

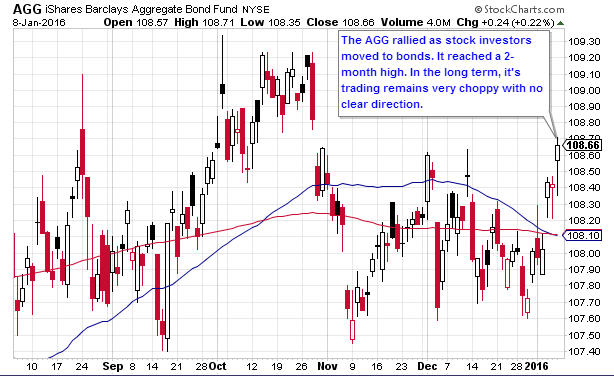
All three stock funds were hit hard. The S, I and C Funds fell 7.17%, 6.38% and 5.90%, respectively. The F Fund gained as bonds were seen as a safe haven.

YTD Return as of 1/8/16: -7.17%
Current allocation: 100% S Fund
New Trades: None.

TSP Fund Performance (1/8/2016 YTD)

G Fund F Fund C Fund S Fund I Fund
0.05% 0.66% -5.90% -7.17% -6.38%

Charts
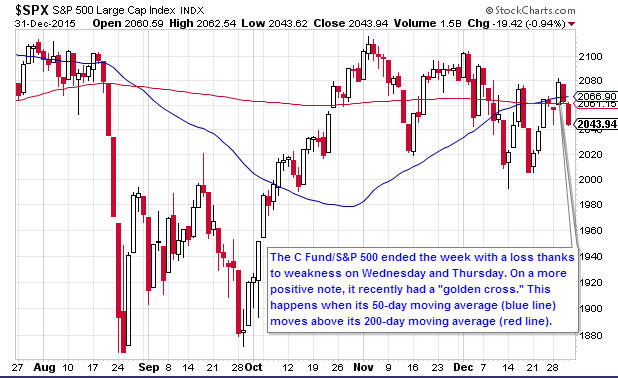
1.  Daily S&P 500 (C Fund Proxy)

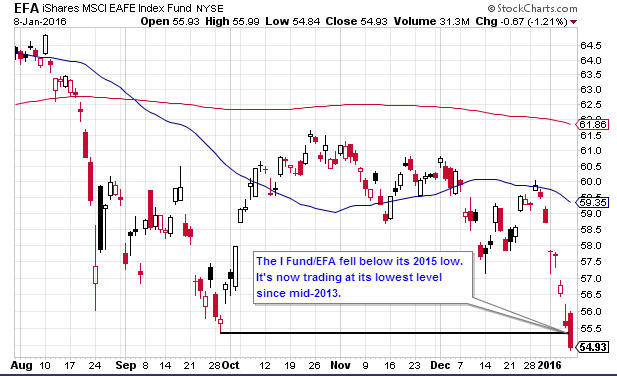
2.  Daily EFA (I Fund Proxy)

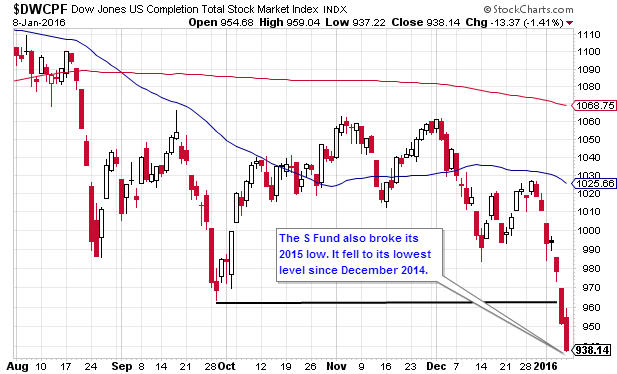
3.  Daily Wilshire 4500 (S Fund Proxy)

4.  Daily AGG (F Fund Proxy)

Get The Full Picture

Weekly Wrap Up

From Briefing.com
Newsletter 1/1/16

Quick Recap of the Week
It was another holiday-shortened week for stocks. Trading volume remained low. A mild “Santa Rally” continued through Tuesday. Stocks then fell during the last two trading days of 2015.

Economic Data
There wasn’t much in the way of market-related news or economic data. Consumer confidence was better-than-expected. However, pending home sales and the Chicago purchasing managers index had disappointing results.

TSP Funds
The S, I and C Funds had similar losses of 1.05%, 0.95% and 0.80%, respectively. The F Fund had a tiny loss of 0.03%.

2016 YTD Return (as of 1/1/16): 0.00%
Current allocation: 100% S Fund
New Trades: None

2016 TSP Fund Performance YTD

G Fund F Fund C Fund S Fund I Fund
0.00% 0.00% 0.00% 0.00% 0.00%

Charts
1.  Daily S&P 500 (C Fund Proxy)

2.  Daily EFA (I Fund Proxy)

3.  Daily Wilshire 4500 (S Fund Proxy)

4.  Daily AGG (F Fund Proxy)

Get The Full Picture

Weekly Wrap Up

From TradeTheNews.com

Newsletter 12/25/15

Quick Recap of the Week
The markets finally got a taste of the Santa Rally. Trading volume was light and markets closed early for the week on Christmas Eve. Despite this, the major stock indices all gained between 2.4% to 3.0%.

Economic Data
Very little economic data was released in the holiday-shortened week. Final gross domestic product and jobless claims were slightly better-than-expected. However, the durable goods orders number came in below its forecast.

TSP Funds
The S Fund led the TSP with a 2.90% gain. The C Fund was close behind, advancing 2.80%. The I Fund moved up by 2.06%, while the F Fund declined by 0.23%.

YTD Return as of 12/25/15: -13.41%
Current allocation: 100% S Fund
New Trades: None.

TSP Fund Performance (12/25/2015 YTD)

G Fund F Fund C Fund S Fund I Fund
2.00% 0.94% 2.27% -1.90% 0.45%

Charts
1.  Daily S&P 500 (C Fund Proxy)

2.  Daily EFA (I Fund Proxy)

3.  Daily Wilshire 4500 (S Fund Proxy)

4.  Daily AGG (F Fund Proxy)

Get The Full Picture

Weekly Wrap Up

From TradeTheNews.com

Newsletter 12/18/15

Quick Recap of the Week
As expected, it was a wild week for stocks. After 7 years of zero interest rates, the Federal Funds rate was finally raised. The stock market rallied when the news was released on Wednesday. Stocks fell later in the week, however. The major U.S. stock indices ended the week with a small loss.

Economic Data
Housing starts, housing permits and jobless claims data were all better-than-expected. Industrial production and the housing market index came in below their forecasts.

TSP Funds
The F, S and C Funds performed very similarly. They had losses of 0.35% (F), 0.34% (S) and 0.31% (C). The I Fund had the only gain of 0.81%.

YTD Return as of 12/18/15: -15.85%
Current allocation: 100% S Fund
New Trades: None.

TSP Fund Performance (12/18/2015 YTD)

G Fund F Fund C Fund S Fund I Fund
1.97% 1.17% -0.51% -4.66% -1.58%

Charts
1.  Daily S&P 500 (C Fund Proxy)

2.  Daily EFA (I Fund Proxy)

3.  Daily Wilshire 4500 (S Fund Proxy)

4.  Daily AGG (F Fund Proxy)

Get The Full Picture

Weekly Wrap Up

From TradeTheNews.com

Newsletter 12/11/15

Quick Recap of the Week
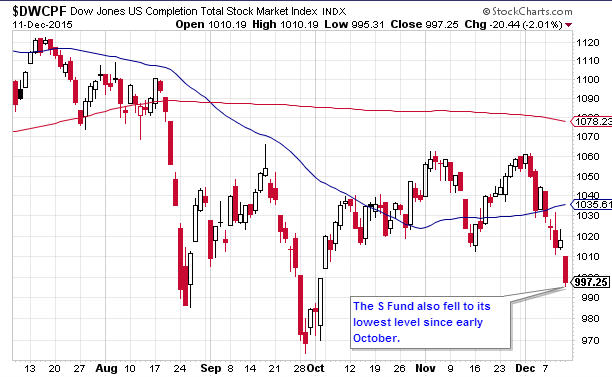
Stocks fell sharply last week. Oil prices at 7-year lows and uncertainty about interest rates caused a strong selling spree. All of the major indexes all fell between 3% and 5%.

Economic Data
On the negative side, Consumer Sentiment fell while jobless claims rose. However, core retail sales were better-than-expected.

TSP Funds
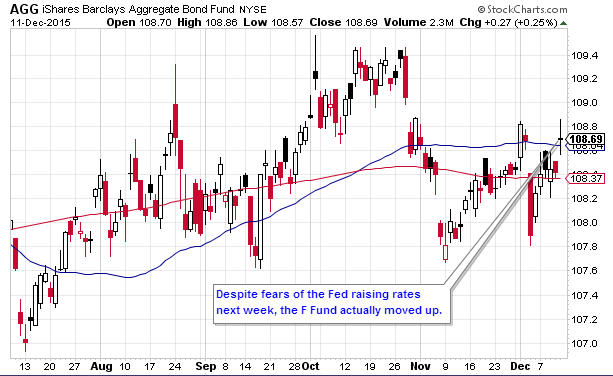
The S Fund was hit the hardest with a 4.46% loss. Not far behind were the I Fund (4.01% loss) and C Fund (3.74% loss). The F Fund moved up 0.48%.

YTD Return as of 12/11/15: -15.57%
Current allocation: 100% S Fund
New Trades: None.

TSP Fund Performance (12/11/2015 YTD)

G Fund F Fund C Fund S Fund I Fund
1.93% 1.52% -0.21% -4.34% -2.37%

Charts
1.  Daily S&P 500 (C Fund Proxy)

2.  Daily EFA (I Fund Proxy)

3.  Daily Wilshire 4500 (S Fund Proxy)

4.  Daily AGG (F Fund Proxy)

Get The Full Picture

Weekly Wrap Up

From Briefing.com
Newsletter 11/20/15

Quick Recap of the Week
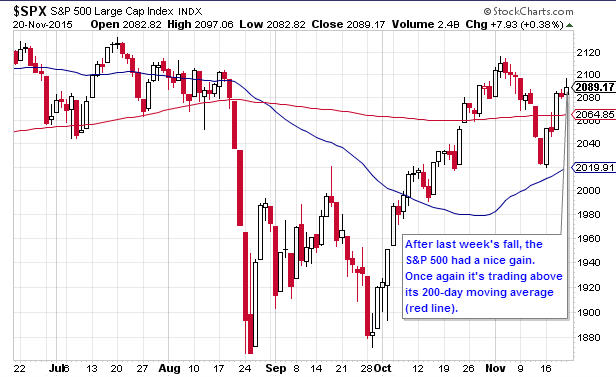
Following the recent pullback, stocks had a strong rally last week. The S&P 500, Dow and Nasdaq all gained nearly 3.5%.

Economic Data
The MBA Mortgage index and Philly Fed survey came in above their forecasts. However, industrial production, housing starts and the Empire Manufacturing index were worse-than-expected.

TSP Funds
The C Fund had the best week with a 3.34% gain. The I Fund advanced by 2.52% while the S Fund moved up 2.48%. The F Fund creeped up by 0.15%.

YTD Return as of 10/16/15: -10.50%
Current allocation: 100% C Fund as of 11/2/15
New Trades: None.

TSP Fund Performance (11/2/2015 YTD)

G Fund F Fund C Fund S Fund I Fund
1.80% 1.01% 3.46% -0.24% 2.32%

Charts
1.  Daily S&P 500 (C Fund Proxy)

2.  Daily EFA (I Fund Proxy)

3.  Daily Wilshire 4500 (S Fund Proxy)

4.  Daily AGG (F Fund Proxy)

Get The Full Picture

Weekly Wrap Up

From Briefing.com