Tag Archives: TSP Funds

Newsletter 8/7/15

Quick Recap of the Week

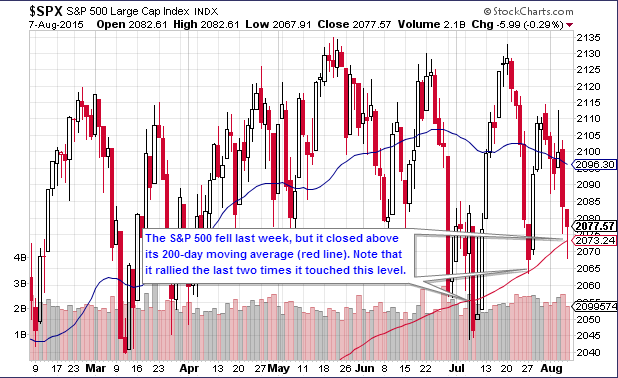
The stock market began the new month on a cautious note. The major indices all fell, with small-cap stocks getting hit the hardest.

Economic data was mostly negative. Employment numbers came in at their forecasted levels. Car sales were unusually strong. However, consumer spending, manufacturing, construction spending and factory orders were worse-than-expected.

  • YTD Return as of 8/7/15: -4.52%
  • Current allocation: 100% C Fund as of 8/3/15
  • New Trades: None.

TSP Fund Performance (8/7/2015 YTD)

G Fund F Fund C Fund S Fund I Fund
1.19% 0.86 2.18% 3.00% 8.14%

Charts

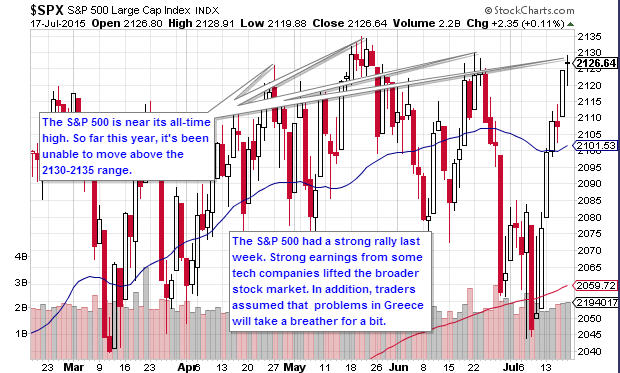
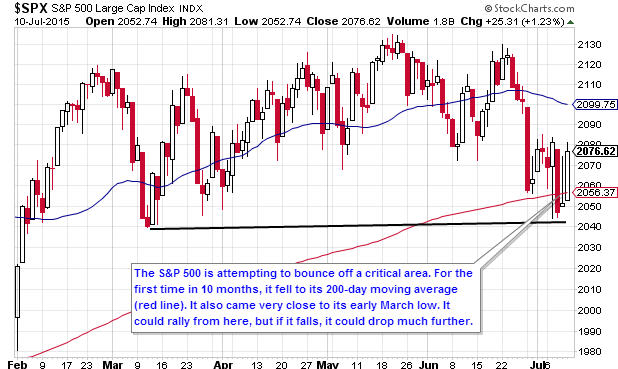
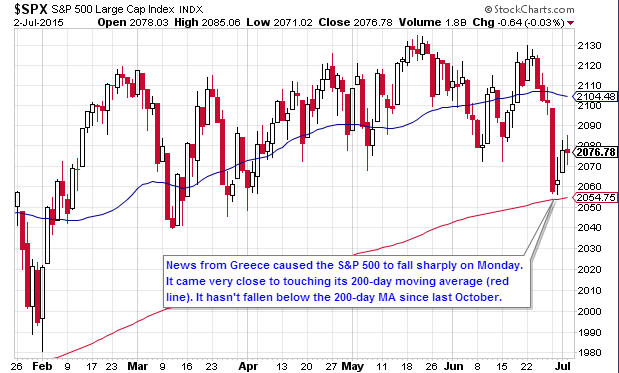
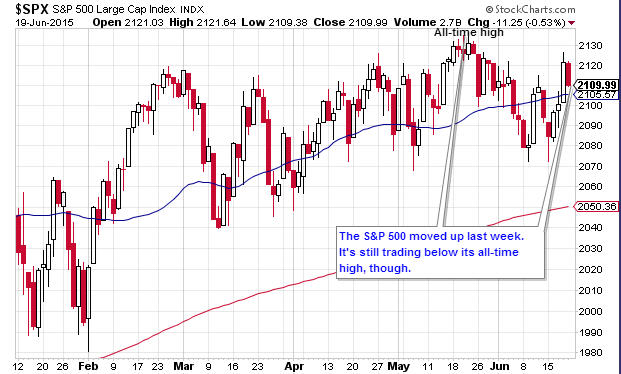
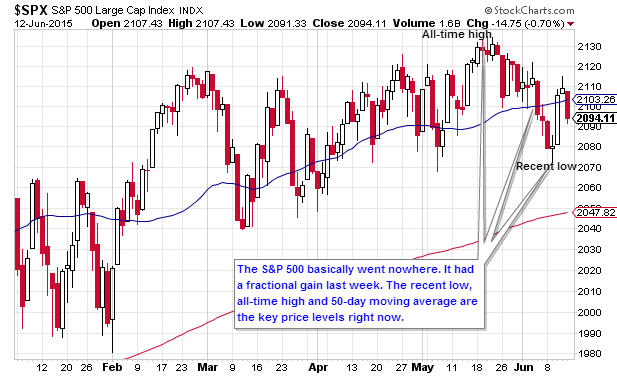
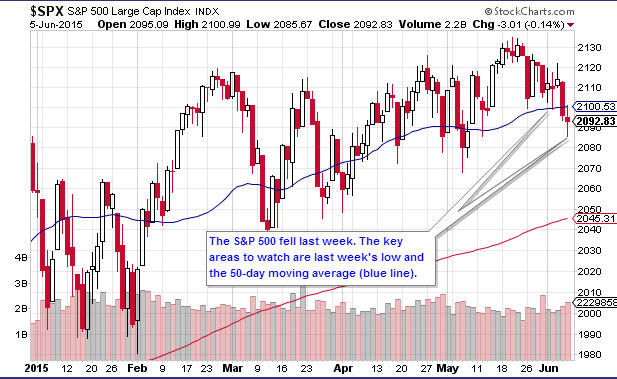
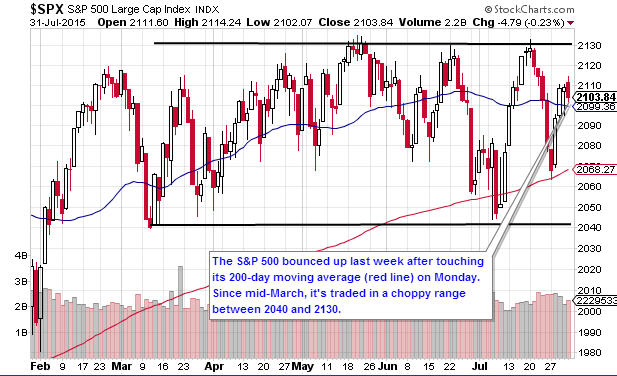
1.  Daily S&P 500 (C Fund Proxy)

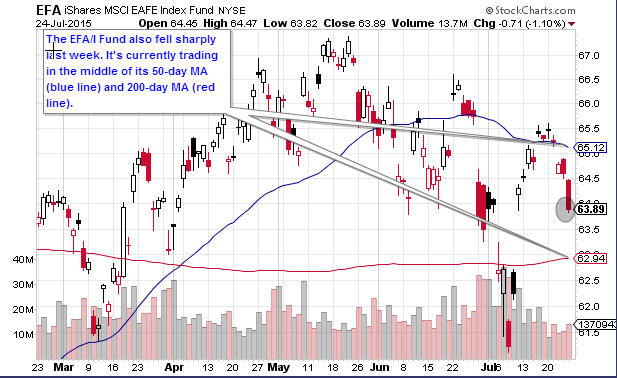
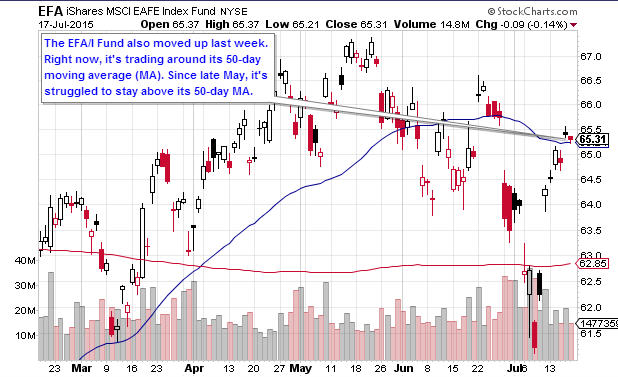
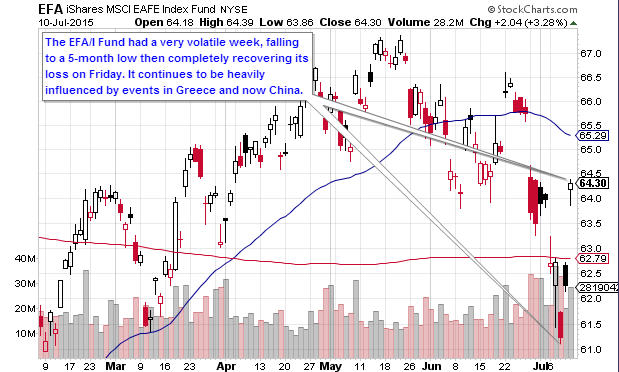
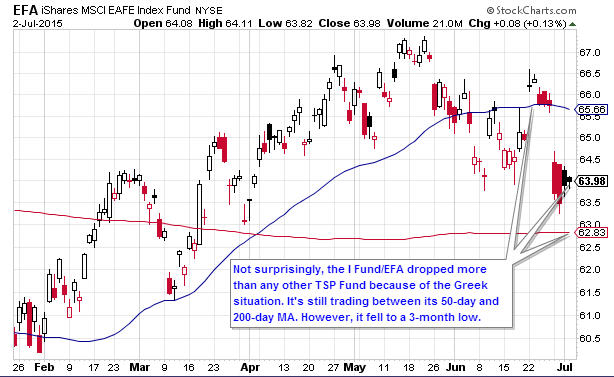
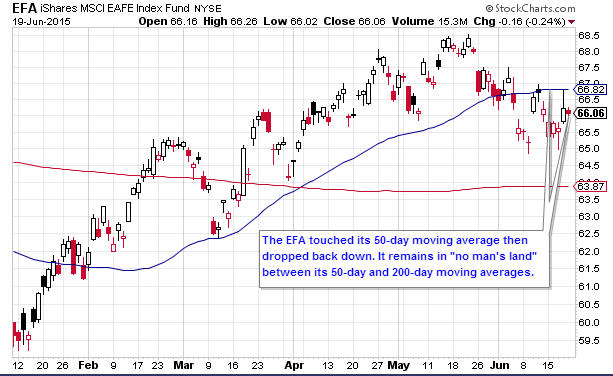
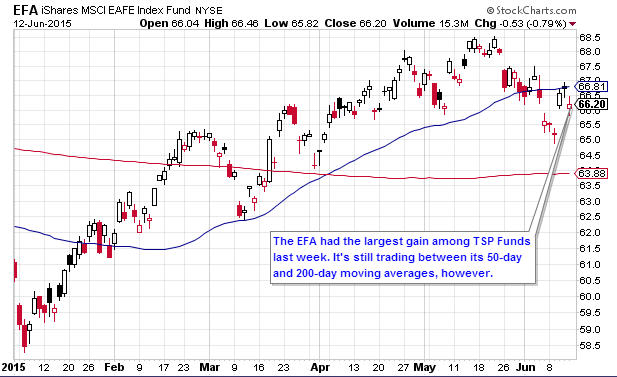
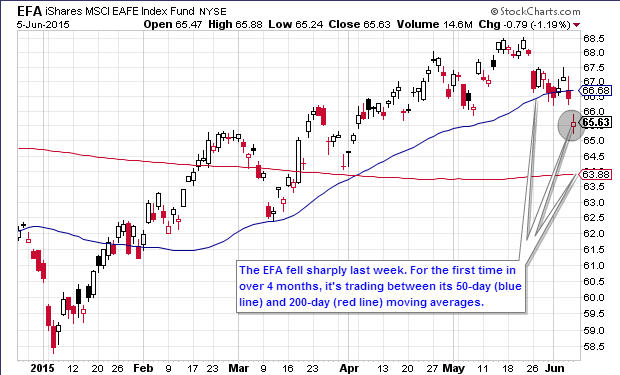
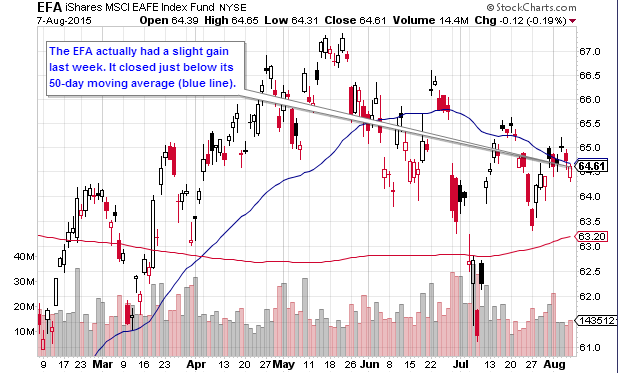
2.  Daily EFA (I Fund Proxy)

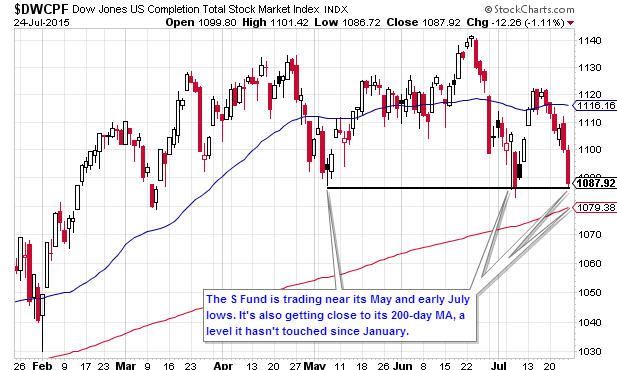
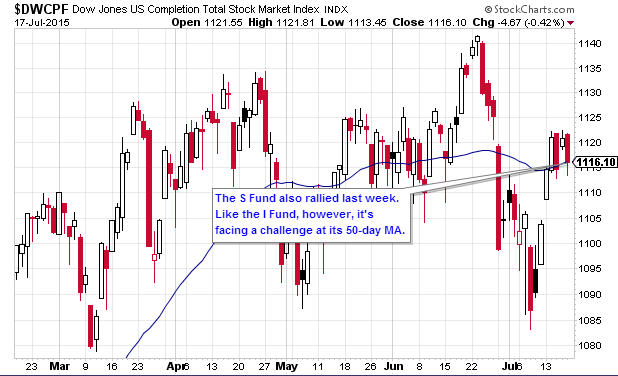
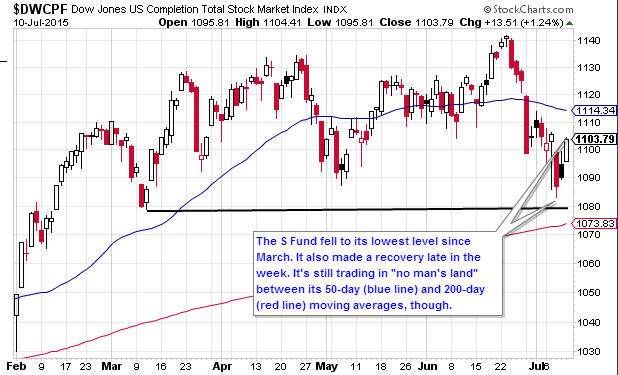
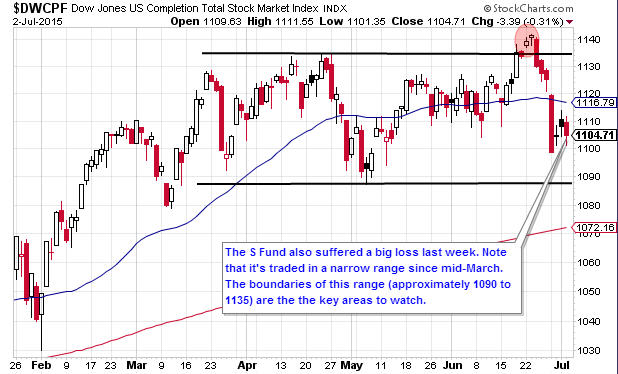
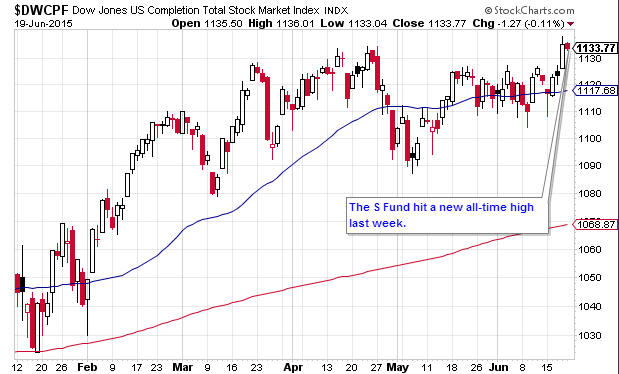
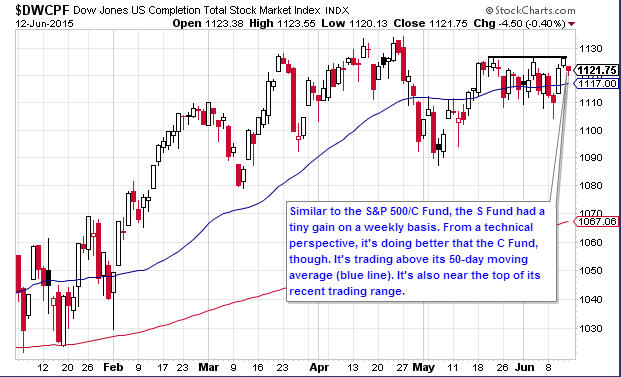
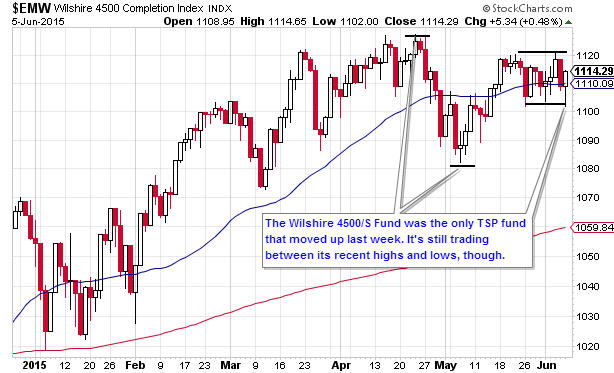
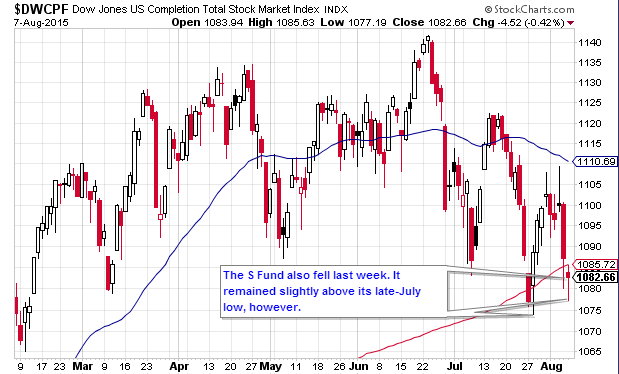
3.  Daily Wilshire 4500 (S Fund Proxy)

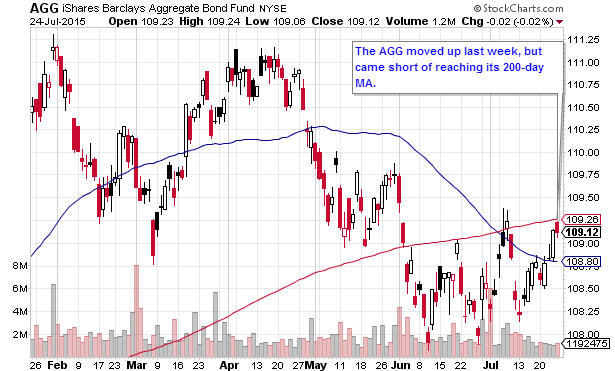
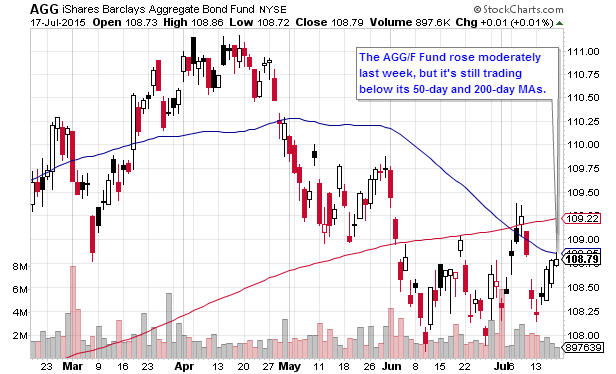
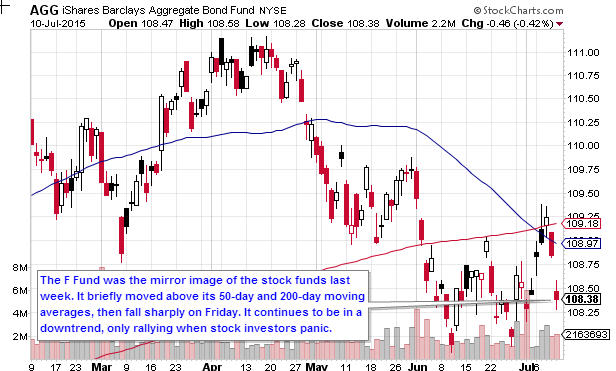
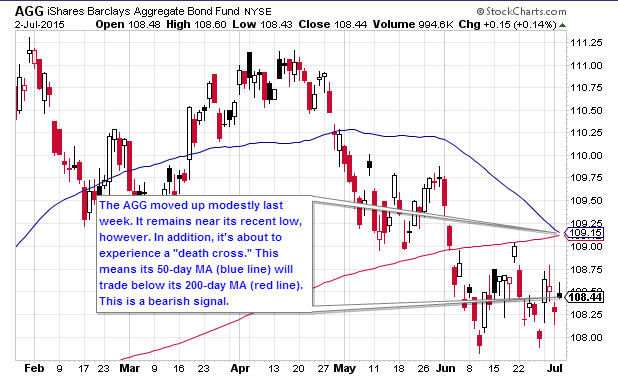
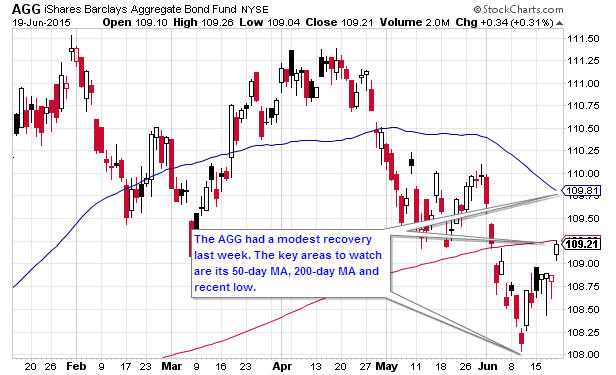
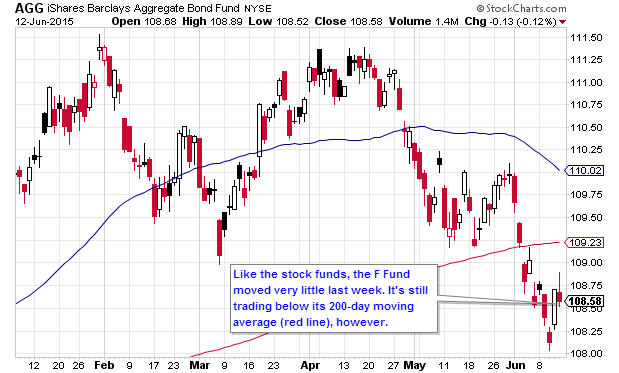
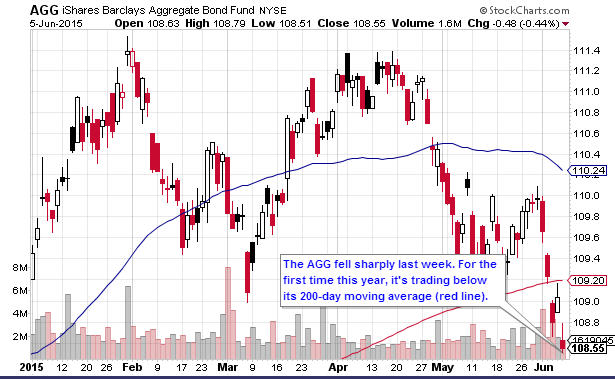
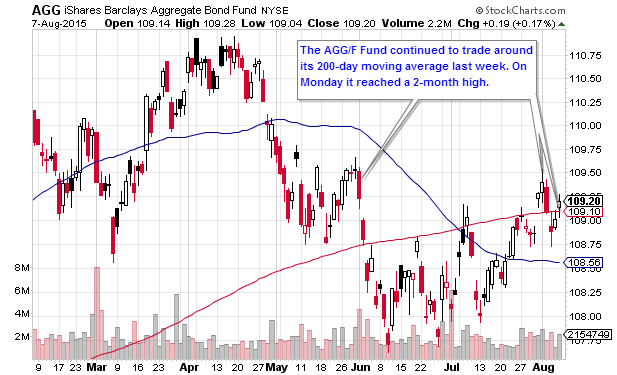
4.  Daily AGG (F Fund Proxy)

Get The Full Picture

Weekly Wrap Up

From Briefing.com
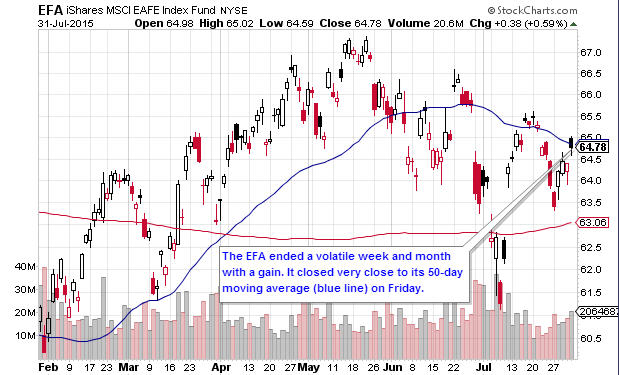
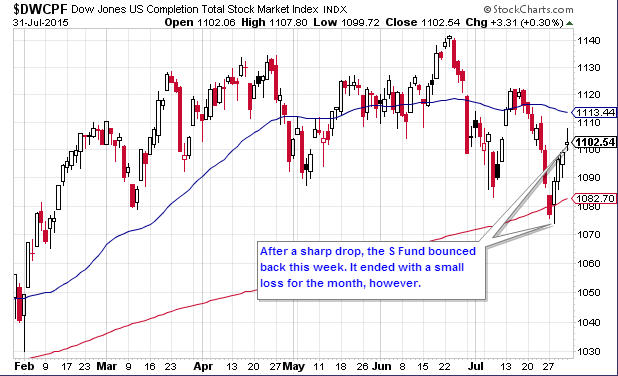
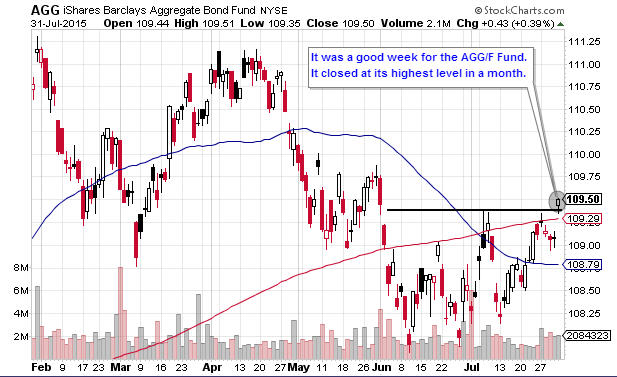
Newsletter 7/31/15

Quick Recap of the Week

Stocks moved up last week after bottoming out on Monday. Economic news was mixed. Durable goods, home prices and the Chicago purchasing manager index were better-than-expected. Consumer confidence hit a 10-month low, however. Pending home sales and the gross domestic product also came in below expectations.

As for the TSP funds, the S had the highest return of 1.37%, followed by the C with a 1.19% gain. The I Fund advanced 1.03% while the F Fund rose 0.33%.

  • YTD Return as of 7/24/15: -3.66%
  • Current allocation: 100% C Fund as of 8/3/2015
  • New Trades: Interfund transfer to 100% C Fund before noon EST on Monday, 8/3/2015

TSP Fund Performance (7/31/2015 YTD)

G Fund F Fund C Fund S Fund I Fund
1.15% 0.79 3.39% 4.83% 8.73%

Charts

1.  Daily S&P 500 (C Fund Proxy)

2.  Daily EFA (I Fund Proxy)

3.  Daily Wilshire 4500 (S Fund Proxy)

4.  Daily AGG (F Fund Proxy)

Get The Full Picture

Weekly Wrap Up

From Briefing.com
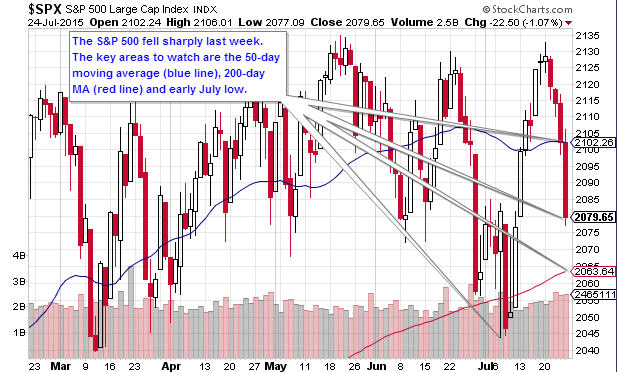
Newsletter 7/24/15

Quick Recap of the Week

Stocks fell last week. The loss was fueled mostly by corporate earnings reports. Investors were disappointed by results from Apple, IBM, Caterpillar and several other firms.

Economic data was mixed. Initial jobless claims and existing home sales were better-than-expected, while new home sales came in below expectations.

As for the TSP, all of the stock funds suffered losses. The S Fund fell by 2.52% while the C Fund had a 2.18% loss. The I Fund declined 1.50%. The F Fund moved up 0.46% as some investors moved to bonds.

  • YTD Return as of 7/24/15: -3.70%
  • Current allocation: 100% G Fund as of 6/30/15
  • New Trades: None.

TSP Fund Performance (7/24/2015 YTD)

G Fund F Fund C Fund S Fund I Fund
1.11% 0.46 2.18% 3.41% 7.62%

Charts

1.  Daily S&P 500 (C Fund Proxy)

2.  Daily EFA (I Fund Proxy)

3.  Daily Wilshire 4500 (S Fund Proxy)

4.  Daily AGG (F Fund Proxy)

Get The Full Picture

Weekly Wrap Up

From Briefing.com
Newsletter 7/17/15

Quick Recap of the Week

Stocks moved up last week. An agreement in Greece allowed the troubled nation to receive rescue funds. While this is only a short-term fix, it was enough to push stocks higher as the week began.

Corporate earnings reports also drove the markets. Overall, results were mixed. However, some big technology stocks, including Google and Intel, had better-than-expected results. This triggered a rally late in the week, especially for Nasdaq stocks.

As for the TSP, the C and I Funds had the biggest gains of 2.31% and 2.26%, respectively. The S Fund was up 1.56%, while the F Fund gained 0.37%.

  • YTD Return as of 7/17/15: -3.74%
  • Current allocation: 100% G Fund as of 6/30/15
  • New Trades: None.

TSP Fund Performance (7/17/2015 YTD)

G Fund F Fund C Fund S Fund I Fund
1.06% 0.16 4.46% 6.08% 9.27%

Charts

1.  Daily S&P 500 (C Fund Proxy)

2.  Daily EFA (I Fund Proxy)

3.  Daily Wilshire 4500 (S Fund Proxy)

4.  Daily AGG (F Fund Proxy)

Get The Full Picture

Weekly Wrap Up

From Briefing.com
Newsletter 7/10/15

Quick Recap of the Week

Stocks moved up slightly in very volatile trading last week. Once again, Greece took the center stage. The week began with the Greeks voting “no” to a proposed bailout from creditors. Later in the week, China’s stock market fell sharply, bringing down other markets throughout the world.

Stocks rebounded after China adopted measures to prevent widespread stock-selling. In the eurozone, optimism rose about Greece accepting new proposals, though nothing substantial happened.

The I Fund had the week’s only significant move, gaining 1.78% despite a sharp fall early in the week. It was followed by the C Fund’s 0.41% gain and a 0.16% advance for the S Fund. The F Fund fell by 0.62%.

  • YTD Return as of 7/10/15: -3.78%
  • Current allocation: 100% G Fund as of 6/30/15
  • New Trades: None.

TSP Fund Performance (7/10/2015 YTD)

G Fund F Fund C Fund S Fund I Fund
1.02% -0.26 1.99% 4.91% 7.10%

Charts

1.  Daily S&P 500 (C Fund Proxy)

2.  Daily EFA (I Fund Proxy)

3.  Daily Wilshire 4500 (S Fund Proxy)

4.  Daily AGG (F Fund Proxy)

Get The Full Picture

Weekly Wrap Up

From Briefing.com
Newsletter 7/3/15

Quick Recap of the Week

Stocks fell last week as Greece and its creditors couldn’t come to an agreement. All of the damage occurred on Monday. For the rest of the week, stocks made a light and unconvincing recovery.

As for the TSP, the I Fund fell 2.21%. The S Fund declined by 1.81%, while the C Fund fell 1.14%. The F Fund gained 0.42% as some investors moved to bonds for safety.

  • YTD Return as of 7/3/15: -3.83%
  • Current allocation: 100% G Fund as of 6/30/15
  • New Trades: None.

TSP Fund Performance (7/3/2015 YTD)

G Fund F Fund C Fund S Fund I Fund
0.97% -0.16 1.96% 4.98% 7.34%

Charts

1.  Daily S&P 500 (C Fund Proxy)

2.  Daily EFA (I Fund Proxy)

3.  Daily Wilshire 4500 (S Fund Proxy)

4.  Daily AGG (F Fund Proxy)

Get The Full Picture

Weekly Wrap Up

From Briefing.com
Newsletter 6/29/2015

Quick Recap of the Week

Stocks fell last week. Financial news was mixed. Consumer spending, home sales and consumer sentiment were better than expected. Durable goods and indexes for
services and manufacturing came in lower than their forecasts.

Concerns about Greece weighed heavily on the market late in the week. As a result, stocks gave up the gains they made on Monday and Tuesday.

Despite the troubles in Greece, the I Fund managed to make a small gain 0.91%. The C and S Funds had losses of 0.37%, and 0.64%, respectively. The F Fund had the worst performance with a 0.90% loss.

  • YTD Return as of 6/26/15: -2.06%
  • Current allocation: 100% G Fund as of 6/30/15
  • New Trades: IFT to 100% G Fund before noon EST on 6/30/15 (Updated 6/29/15)

TSP Fund Performance (6/26/2015 YTD)

G Fund F Fund C Fund S Fund I Fund
0.93% -0.58 3.13% 6.91% 9.77%

Charts

1.  Daily S&P 500 (C Fund Proxy)

2.  Daily EFA (I Fund Proxy)

3.  Daily Wilshire 4500 (S Fund Proxy)

4.  Daily AGG (F Fund Proxy)

Get The Full Picture

Weekly Wrap Up

From Briefing.com
Newsletter 6/19/15

Quick Recap of the Week

The stock market moved up last week. Economic data was mixed. Building permits, homebuilder sentiment and the Philadelphia fed index were better than expected. Consumer prices rose, however, while capacity utilization was lower than its forecast.

The biggest news item was the Federal Reserve’s policy statement. As expected the Fed didn’t raise rates. However, they implied they would probably raise rates by year-end. Fed Chair Janet Yellen said it would depend on inflation and employment data.

As for the TSP, the S Fund was the top performer. It was followed by the C and F Funds, respectively. The I Fund suffered a loss as problems in Greece weighed on European stocks.

  • YTD Return as of 6/19/15: -1.40%
  • Current allocation: 100% S Fund as of 5/29/15
  • New Trades: None.

TSP Fund Performance (6/29/2015 YTD)

G Fund F Fund C Fund S Fund I Fund
0.90% 0.32 3.51% 7.60% 8.78%

Charts

1.  Daily S&P 500 (C Fund Proxy)

2.  Daily EFA (I Fund Proxy)

3.  Daily Wilshire 4500 (S Fund Proxy)

4.  Daily AGG (F Fund Proxy)

Get The Full Picture

Weekly Wrap Up

From Briefing.com
Newsletter 6/12/15

Quick Recap of the Week

Choppy, indecisive trading continued last week as the markets entered the “summer doldrums.” The major stock market indices had very small gains. Economic data was mostly positive. Consumer sentiment, retail sales, job openings and Japanese gross domestic product were better-than-expected.

As for the TSP, the I Fund led the way with a 1.39% gain. It was followed by the S and C Funds, which advanced 0.16% and 0.12%, respectively. The F Fund moved up 0.04%.

  • YTD Return as of 6/12/15: -2.47%
  • Current allocation: 100% S Fund as of 5/29/15
  • New Trades: None.

TSP Fund Performance (6/12/2015 YTD)

G Fund F Fund C Fund S Fund I Fund
0.86% -0.19 2.71 6.46% 9.21%

Charts

1.  Daily S&P 500 (C Fund Proxy)

2.  Daily EFA (I Fund Proxy)

3.  Daily Wilshire 4500 (S Fund Proxy)

4.  Daily AGG (F Fund Proxy)

Get The Full Picture

Weekly Wrap Up

From Briefing.com
Newsletter 6/5/15

Quick Recap of the Week

Stocks had mixed results last week. Small-caps performed well, large-caps had modest losses and the Nasdaq remained flat.

Economic data was positive overall. Job growth, wages and the ISM manufacturing index were better-than-expected. The ISM services index fell and came in below its estimate. Bonds fell sharply, hinting that the 30-year bond bubble may be in its last stages.

The S Fund was the best TSP performer with a 0.55% gain. Besides the G Fund, all of the others had losses. The C Fund fell 0.65%, the F Fund dropped 1.35% and the I Fund declined by 1.71%.

  • YTD Return as of 6/5/15: -2.62%
  • Current allocation: 100% S Fund as of 5/1/15
  • New Trades: None.

TSP Fund Performance (6/5/2015 YTD)

G Fund F Fund C Fund S Fund I Fund
0.82% -0.24 2.59% 6.29% 7.71%

Charts

1.  Daily S&P 500 (C Fund Proxy)

2.  Daily EFA (I Fund Proxy)

3.  Daily Wilshire 4500 (S Fund Proxy)

4.  Daily AGG (F Fund Proxy)

Get The Full Picture

Weekly Wrap Up

From Briefing.com