Tag Archives: TSP Funds

Newsletter 5/29/15

Quick Recap of the Week

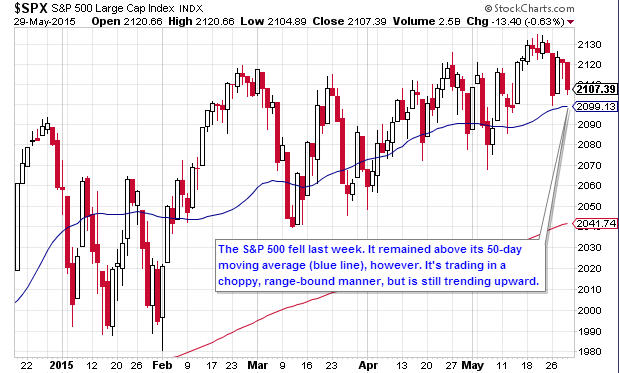
The stock market fell last week. For the first time in several months, most economic data releases were better-than-expected. This was trumped by two factors, however.

The first was the Fed. Last week, Fed Chair Janet Yellen said she expects to raise interest rates sometime this year if the economy meets her forecasts. This week, her comments were echoed by San Francisco Fed Bank President John Williams.

The other factor was gross domestic product (GDP). Although it was slightly better than economists expected, it still came in at a negative number for the first quarter.

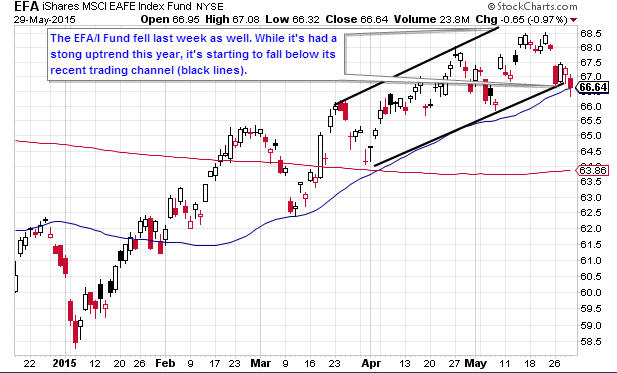
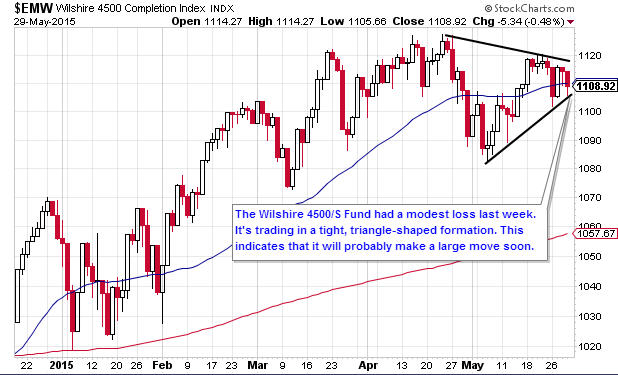
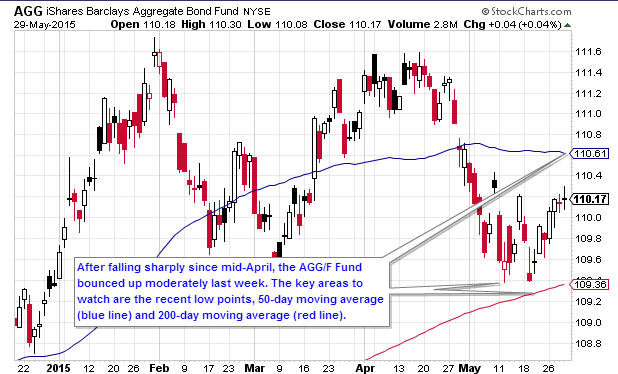
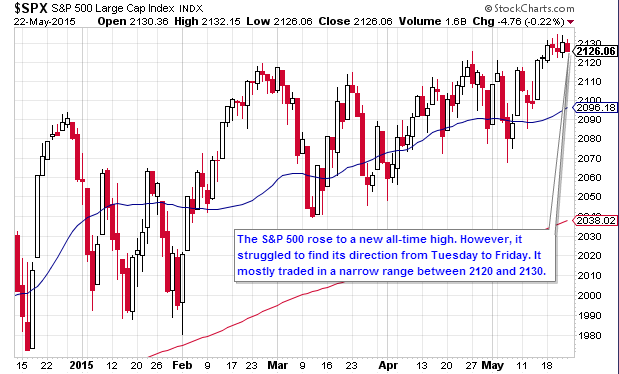
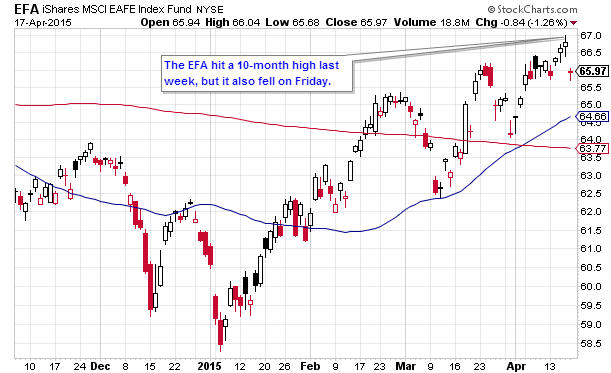
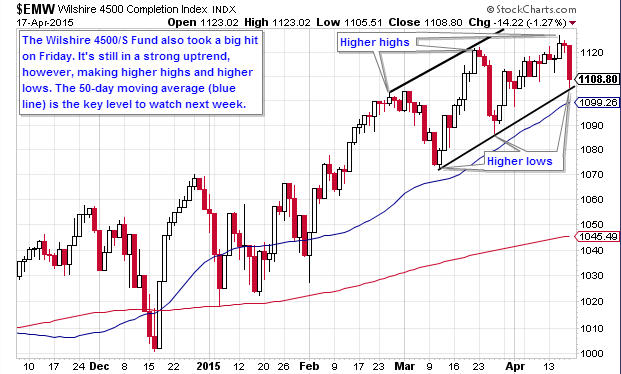
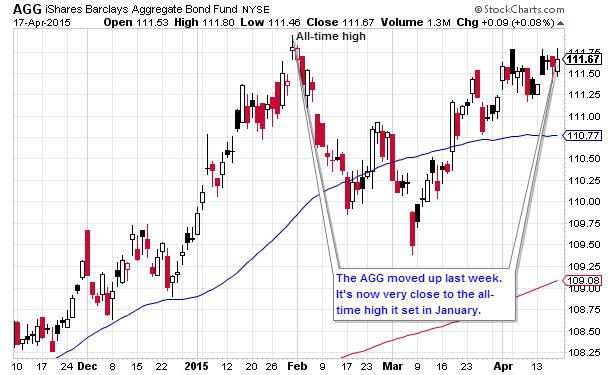
As for the TSP funds, the F was the best performer with a 0.63% gain. Following it were the S Fund (0.68% loss), C Fund (0.84% loss) and I Fund (1.83% loss).

  • YTD Return as of 5/29/15: -3.16%
  • Current allocation: 100% S Fund as of 5/29/15
  • New Trades: None.

TSP Fund Performance (5/29/2015 YTD)

G Fund F Fund C Fund S Fund I Fund
0.79% 1.13% 3.26% 5.71% 9.59%

Charts

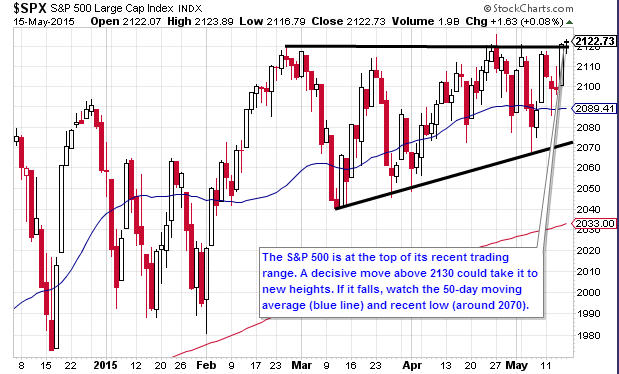
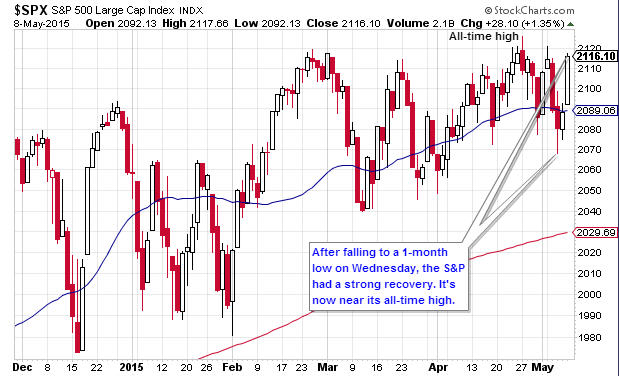
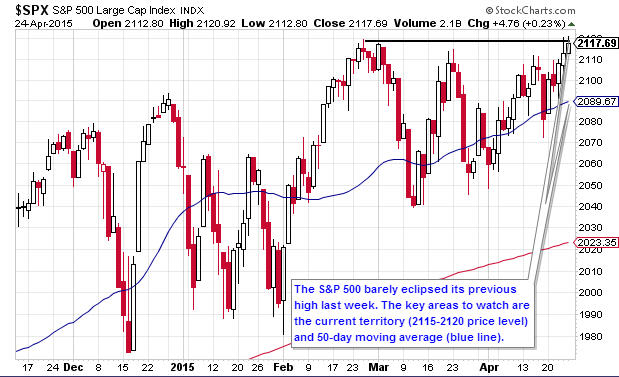
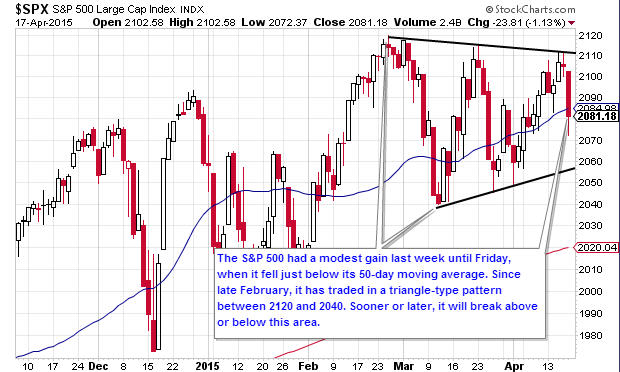
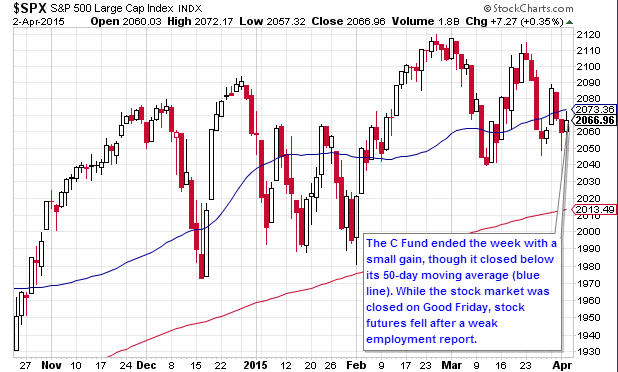
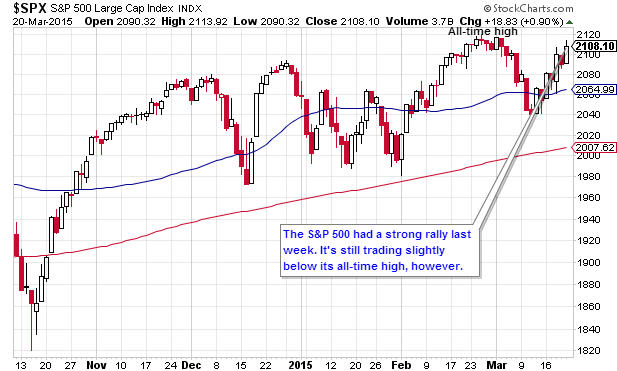
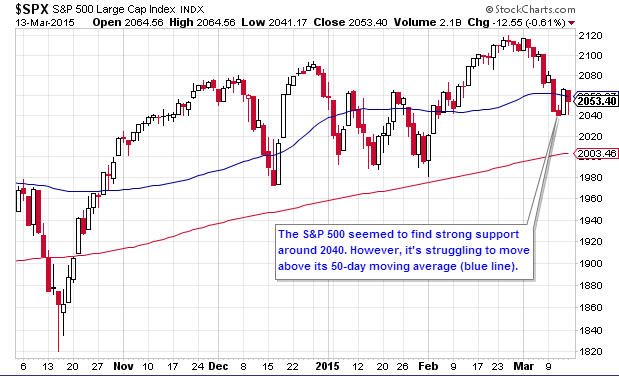
1.  Daily S&P 500 (C Fund Proxy)

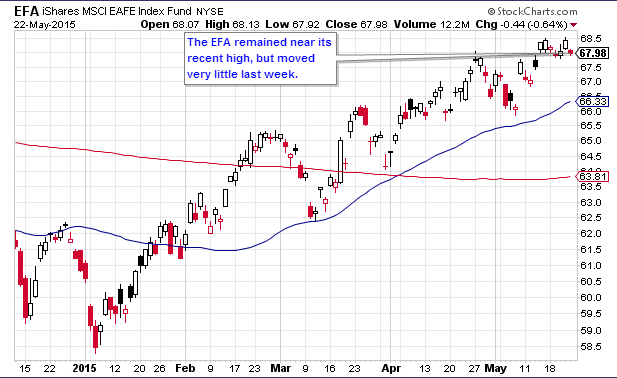
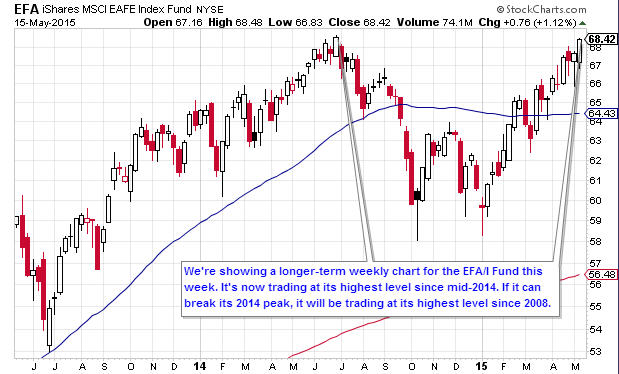
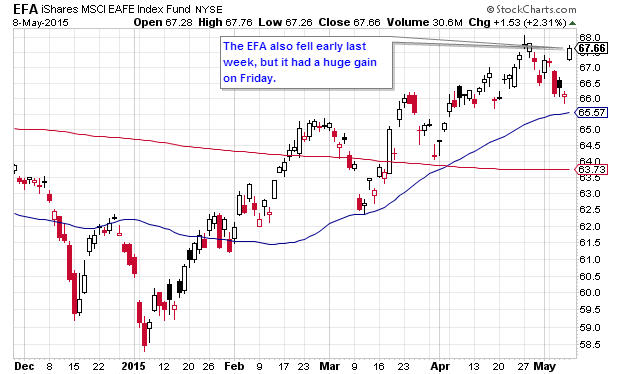
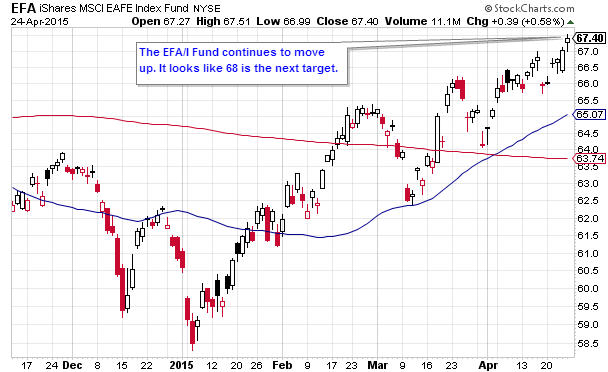
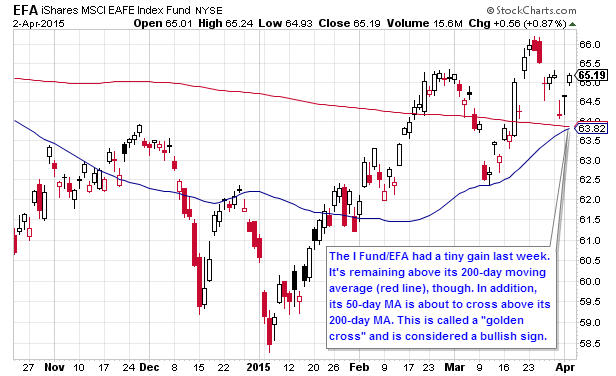
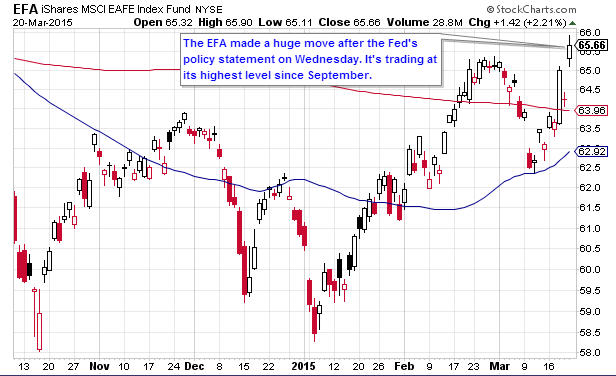
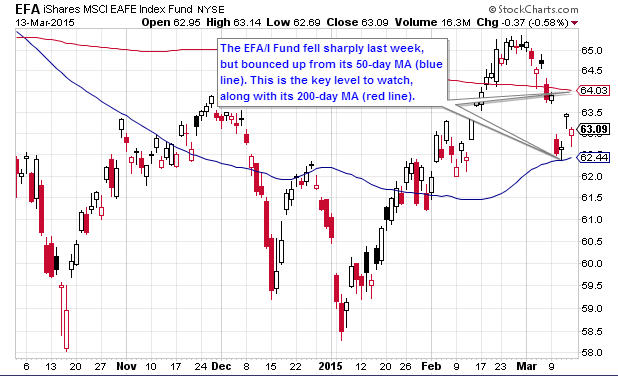
2.  Daily EFA (I Fund Proxy)

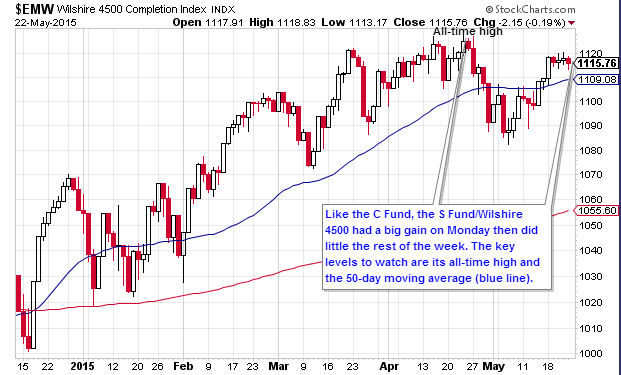
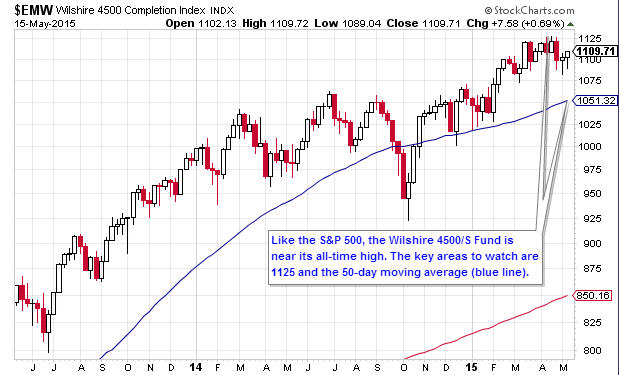
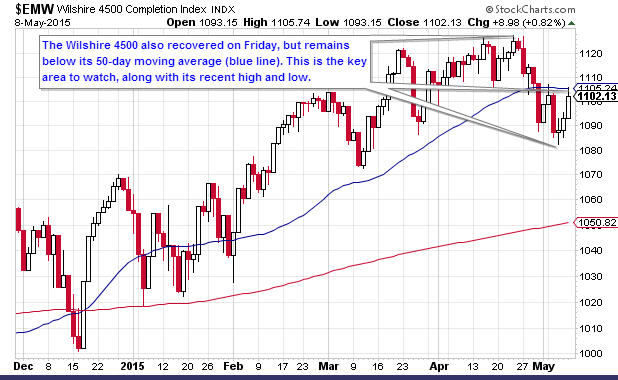
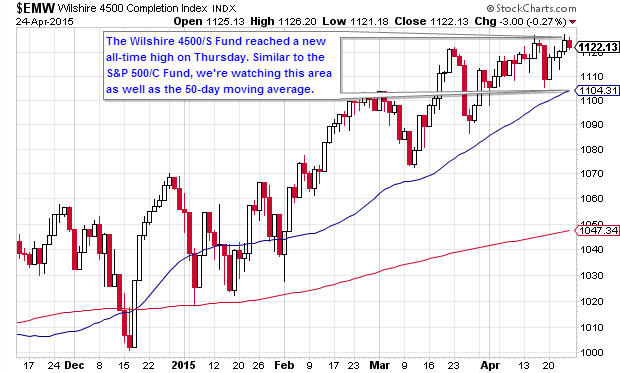
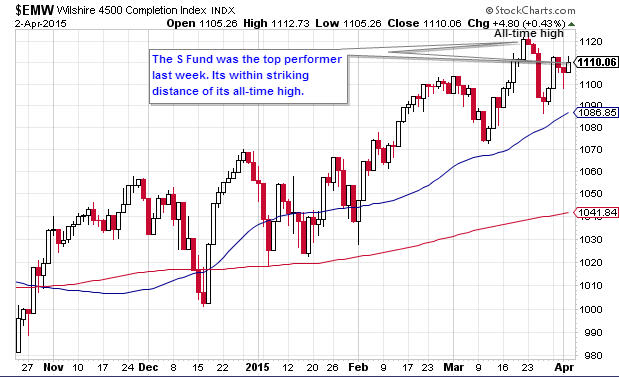
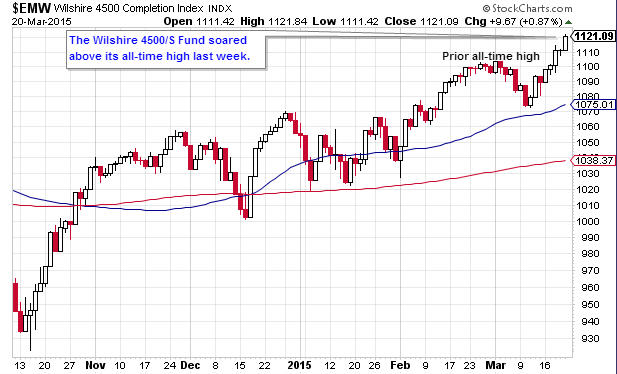
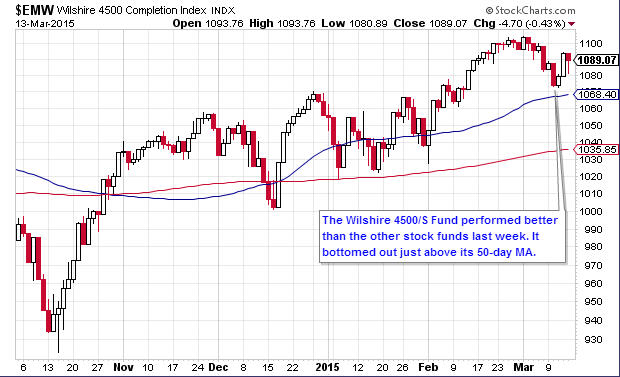
3.  Daily Wilshire 4500 (S Fund Proxy)

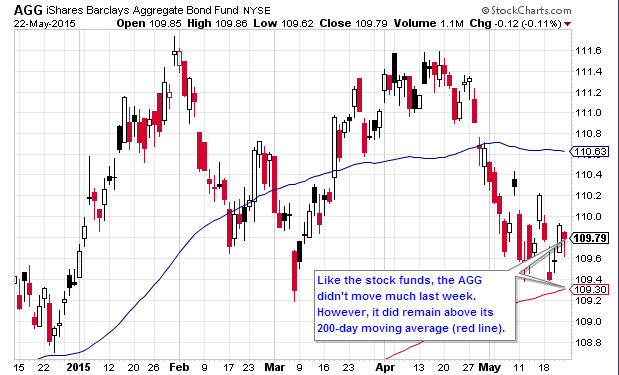
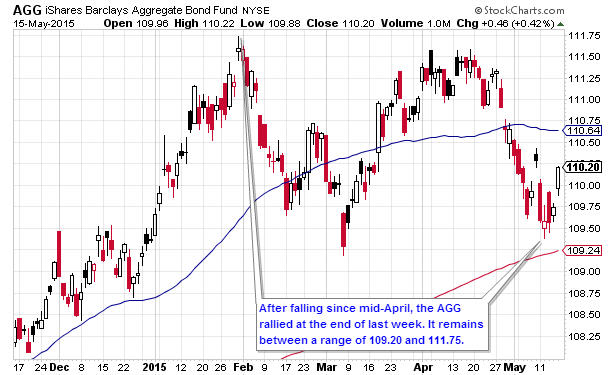
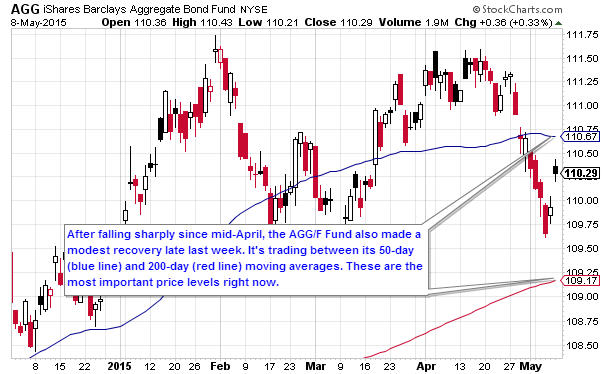
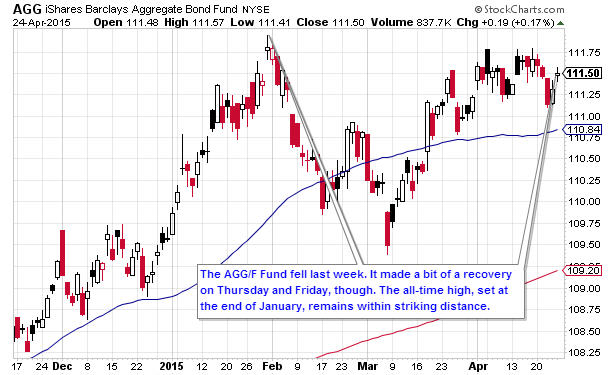
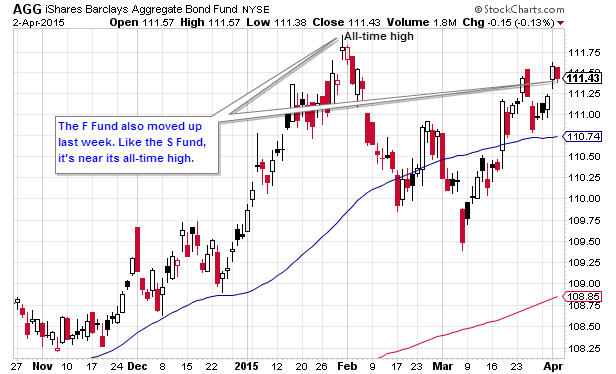
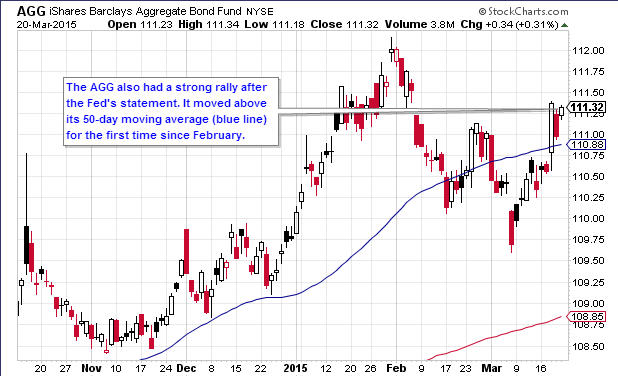
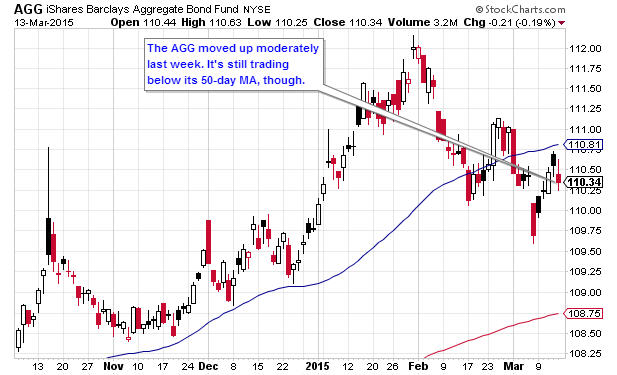
4.  Daily AGG (F Fund Proxy)

Get The Full Picture

Weekly Wrap Up

From TradeTheNews.com
Newsletter 5/22/15

Quick Recap of the Week

Stocks had mixed results last week. There wasn’t much market-related news or significant economic data. The main driver for the week was the Federal Reserve’s meeting minutes. The minutes indicated that a June interest rate hike was unlikely.

The S Fund had the biggest gain of 0.68%. The C Fund advanced by 0.21%. The I and F Funds fell by 0.59% and 0.48% respectively.

  • YTD Return as of 5/22/15: -1.35%
  • Current allocation: 100% S Fund as of 5/29/15
  • New Trades: IFT from 100% I Fund to 100% S Fund by noon EST on Friday, 5/29/15

TSP Fund Performance (5/22/2015 YTD)

G Fund F Fund C Fund S Fund I Fund
0.74% 0.50% 4.13% 6.44% 11.63%

Charts

1.  Daily S&P 500 (C Fund Proxy)

2.  Daily EFA (I Fund Proxy)

3.  Daily Wilshire 4500 (S Fund Proxy)

4.  Daily AGG (F Fund Proxy)

Get The Full Picture

Weekly Wrap Up

From Briefing.com
Newsletter 5/15/15

Quick Recap of the Week

Stocks rose modestly last week, even though most economic data releases were worse-than-expected. A falling U.S. Dollar enabled the I Fund to have the biggest gain of 1.46%. The S Fund rose 0.79%, while the C Fund increased by 0.39%. The F Fund had a tiny gain of 0.03%.

  • YTD Return as of 5/15/15: -0.77%
  • Current allocation: 100% I Fund as of 5/5/15
  • New Trades: None.

TSP Fund Performance (5/15/2015 YTD)

G Fund F Fund C Fund S Fund I Fund
0.70% 0.98% 3.91% 5.72% 12.29%

Charts

1.  Daily S&P 500 (C Fund Proxy)

2.  Daily EFA (I Fund Proxy)

3.  Daily Wilshire 4500 (S Fund Proxy)

4.  Daily AGG (F Fund Proxy)

Get The Full Picture

Weekly Wrap Up

From Briefing.com
Newsletter 5/8/15

The Markets

Stocks moved up last week. After falling several days, stocks had a strong rally on Friday. This was mostly due to employment data, which came in near expectations. Traders were happy the data was reasonably good, but not too strong. If employment numbers are too favorable, it could prompt a near-term rate hike by the Fed.

The I Fund was the week’s top performer with a 0.84% gain. The C Fund advanced 0.44% while the S Fund increased by 0.33%. The F Fund fell slightly by 0.07%.

  • YTD Return as of 5/8/15: -2.20%
  • Current allocation: 100% I Fund as of 5/5/15
  • New Trades: None

TSP Funds’ Performance YTD (as of 5/8/15)

G Fund F Fund C Fund S Fund I Fund
0.66% 0.94% 3.51% 4.89% 10.67%

Charts

1.  Daily S&P 500 (C Fund Proxy)

2.  Daily EFA (I Fund Proxy)

3.  Daily Wilshire 4500 (S Fund Proxy)

4.  Daily AGG (F Fund Proxy)

Get The Full Picture

Weekly Wrap Up

From Briefing.com
Newsletter 4/24/15

Quick Recap of the Week

The stock market had another strong week. Once again, economic data was mostly worse-than-expected. This didn’t stop the bulls, however. Several major indexes, including the S&P 500 and Nasdaq, hit new all-time highs.

The I Fund led the TSP with a 2.06% gain. The S Fund followed, moving up 1.77%. The S Fund rose 1.28% while the F Fund dropped by -0.22%.

  • YTD Return as of 4/24/15: -0.38%
  • Current allocation: 100% S Fund as of 3/2/15
  • New Trades: None.

TSP Fund Performance (4/24/2015 YTD)

G Fund F Fund C Fund S Fund I Fund
0.59% 1.96% 3.49% 6.90% 10.73%

Charts

1.  Daily S&P 500 (C Fund Proxy)

2.  Daily EFA (I Fund Proxy)

3.  Daily Wilshire 4500 (S Fund Proxy)

4.  Daily AGG (F Fund Proxy)

Get The Full Picture

Weekly Wrap Up

From Briefing.com

Newsletter 4/17/15

Quick Recap of the Week

The stock market fell last week. While most economic data was disappointing, stocks enjoyed a small rally until Friday. At that point, bad news from overseas took down U.S. markets. New Chinese investing regulations caused an overnight slide in Asia, while concerns about Greece lowered share prices in Europe.

As for the TSP funds, the S fell 1.01% while the C Fund dropped by 0.98%. The I Fund declined 0.24%, whle the F Fund gained 0.45%.

  • YTD Return as of 4/17/15: -1.63%
  • Current allocation: 100% S Fund as of 3/2/15
  • New Trades: None.

TSP Fund Performance (3/20/2015 YTD)

G Fund F Fund C Fund S Fund I Fund
0.55% 2.18% 1.69% 5.55% 8.50%

Charts

1.  Daily S&P 500 (C Fund Proxy)

2.  Daily EFA (I Fund Proxy)

3.  Daily Wilshire 4500 (S Fund Proxy)

4.  Daily AGG (F Fund Proxy)

Get The Full Picture

Weekly Wrap Up

From Briefing.com

Three Reasons You Shouldn’t Buy-and-Hold (Market Timing Part 1)

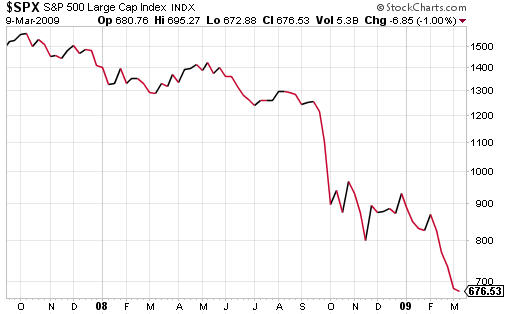
Does this look like a good time to hold stocks?

Blog 6 Chart

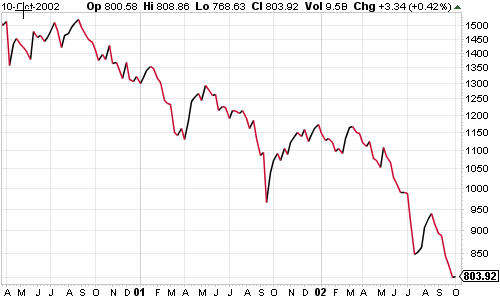
This was the crash following the “dot-com bubble.” In less than 3 years, the S&P 500 fell more than 50% from its peak. Some analysts called it a once-in-a-lifetime event. Then, just five years later, this happened:

2000 to 2002
2000 to 2002

The S&P 500 fell even further…and it happened twice as fast. In just 18 months it dropped 56% from its October 2007 peak.

Is buy-and-hold dead?

Did the wild, account-shrinking ride from 2000-2009 (the “lost decade”) kill buy-and-hold? Some think so, but there’s not much evidence. Financial advisers still tell us “you can’t time the market.” The financial media still claims buy-and-hold is a good strategy based on selective studies.

Despite its continuing popularity, you should consider three powerful arguments against buy-and-hold. We’ll cover the first—risk management—in today’s blog.

Lack of risk management

What do business, military operations, sports, politics and even professional gambling have in common? Risk management. In all these fields, planning and strategy are important. And managing risks is a big part of any strategy.

Buy-and-holders, on the other hand, choose to ignore market dangers. Other than diversification, they have no risk-reducing tools. Since the TSP Funds are already well-diversified, this isn’t an issue anyway. There’s no risk of owning an individual stock that could go bankrupt in your TSP account.

If the whole stock market falls

Diversification doesn’t help much in a crash. The C, S and I Funds all fell more than 55% from their 2007 peaks to 2009 lows. If you held a combination of those funds, you’d still suffer a 55%+ loss.

If the market plunges, buy-and-holders have no exit plan. They only have faith that stocks will rebound. In the long-term this has worked so far—at least in the U.S. However, it can take years or even decades for stocks to recover from a big crash. That’s why some critics call it “buy and hope.”

Investors learned this the hard way during the lost decade. Some had to postpone their retirement plans. Others were already retired. They could only watch as a big chunk of their savings disappeared. Many were forced to reduce their quality of life or go back to work.

Everybody has a plan

It’s one thing to plan for good outcomes, but what if things go wrong? As legendary boxer Mike Tyson said, “Everybody has a plan until they get punched in the face.”

Figuratively speaking, the markets will punch you in the face sometimes. When it happens, what will you do? Buy and hope…or put a risk management plan into action?

Newsletter 4/3/15

Quick Recap of the Week

The stock market edged up in a holiday-shortened week. There wasn’t much news or economic data until Friday, when monthly employment data was released. The unemployment rate remained the same. However, the number of new jobs was considerably less than expected.

Since the stock exchanges were closed for Good Friday, this didn’t affect the stock market or TSP share prices. However, stock futures fell around 1%.

This was a bit surprising, since stocks have rallied on bad news recently. The rationale is that the Fed will delay interest rate hikes if the economy is sluggish. Traders now have the weekend to mull over the employment data. On Monday, we’ll see if their reaction has changed.

As for the TSP, the S Fund led the pack with a 1.02% gain. The C Fund moved up 0.32%, followed by the F Fund’s 0.26% increase. The I Fund barely made progress with a 0.06% gain.

  • YTD Return as of 4/3/15: -1.62%
  • Current allocation: 100% S Fund as of 3/2/15
  • New Trades: None.

TSP Fund Performance (4/3/2015 YTD)

G Fund F Fund C Fund S Fund I Fund
0.47% 1.82% 0.94% 5.56% 6.93%

Charts

1.  Daily S&P 500 (C Fund Proxy)

2.  Daily EFA (I Fund Proxy)

3.  Daily Wilshire 4500 (S Fund Proxy)

4.  Daily AGG (F Fund Proxy)

Get The Full Picture

Weekly Wrap Up

From Briefing.com

Newsletter 3/20/15

Quick Recap of the Week

The Federal Reserve released their most recent statement on Wednesday. Not surprisingly, trading was centered around the statement–both before and after it was released.

The Fed removed the word “patient” from their statement. Many thought this would cause a selloff. However, the Fed’s comments on gross domestic product and inflation suggested a rake hike may not be imminent. As a result, stocks had a strong rally.

As for the TSP Funds, the I Fund led the way with a 4.03% gain. The S Fund had a 2.92% advance, and the C Fund incresed by 2.67%. The F Fund gained 0.81% as bonds also rallied on the Fed’s interest rate stance.

  • YTD Return as of 3/20/15: -0.70%
  • Current allocation: 100% S Fund as of 3/2/15
  • New Trades: None.

TSP Fund Performance (3/20/2015 YTD)

G Fund F Fund C Fund S Fund I Fund
0.41% 1.52% 2.87% 6.55% 7.61%

Charts

1.  Daily S&P 500 (C Fund Proxy)

2.  Daily EFA (I Fund Proxy)

3.  Daily Wilshire 4500 (S Fund Proxy)

4.  Daily AGG (F Fund Proxy)

Get The Full Picture

Weekly Wrap Up

From Briefing.com

Newsletter 3/13/15

Quick Recap of the Week

The stock market had mixed results last week. Small-cap and tech stocks saw gains, while large-cap and international stocks fell. Economic data was also mixed. Most of it was worse-than-expected, however, including retail sales and consumer sentiment.

As for the TSP funds, the F and S Funds led the way with 0.53% and 0.51% increases, respectively. The C Fund fell by 0.80% while the I Fund had a 1.73% loss.

  • YTD Return as of 3/13/15: -3.52%
  • Current allocation: 100% S Fund as of 3/13/14
  • New Trades: None.

TSP Fund Performance (3/13/2015 YTD)

G Fund F Fund C Fund S Fund I Fund
0.37% 0.71% 0.20% 3.53% 3.44%

Charts

1.  Daily S&P 500 (C Fund Proxy)

2.  Daily EFA (I Fund Proxy)

3.  Daily Wilshire 4500 (S Fund Proxy)

4.  Daily AGG (F Fund Proxy)

Get The Full Picture

Weekly Wrap Up

From Briefing.com