Tag Archives: TSP Funds

Newsletter 2/27/15

Quick Recap of the Week

First a note–our allocation is changing to 100% S Fund. Please make your IFT and contribution allocation before noon EST on Monday, 3/2/2015.

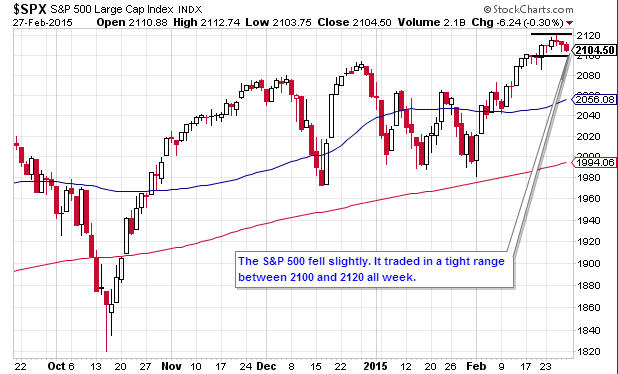
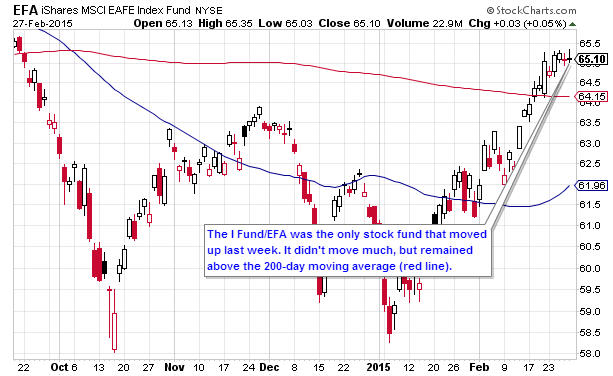
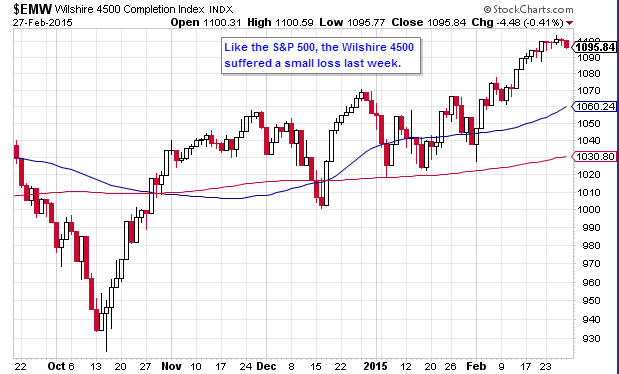
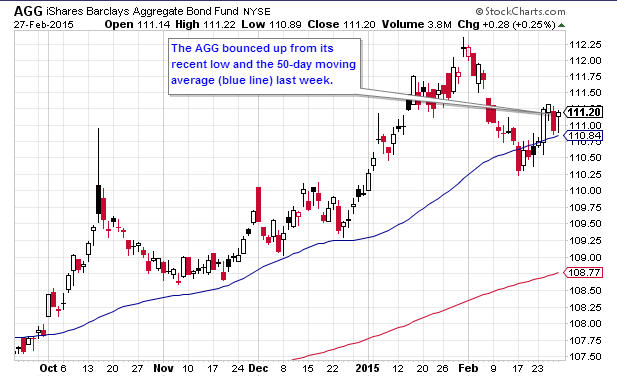
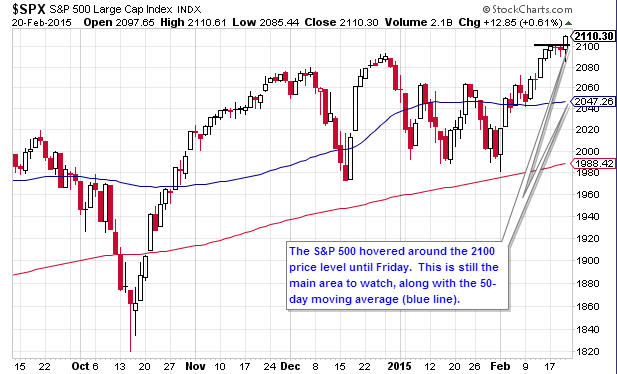
Last week U.S. stocks fell moderately in choppy, indecisive trading. Most economic data was worse-than-expected. Of the TSP Funds, the F Fund had the best week with a 0.70% gain. The I Fund advanced by 0.49%. The C and S Funds had losses of -0.24% and -0.32%, respectively.

A Note About the Markets and our System

The markets have been difficult to decipher over the last 6 months. Just when a TSP fund begins a clear upward trend, it seems to fall or go flat. For investors who follow the market’s trends (like us), these are challenging conditions.

This prompted us to do a lot of research and testing. Based on this, our system will incorporate certain seasonal patterns. We did this with good success in 2012-2013.

When it’s a good “season” for stocks (like now), at least 50% of our allocation will be in stock funds. When it’s a historically poor season for stocks, at least 50% of our allocation will be in the G or F Fund.

We’ll continue to follow the market’s trends as well. Following trends/momentum is the most proven way to outperform buy-and-hold. Studies going as far back as 800 years show this.

Certain seasonal patterns have strong track records, too. One has outperformed the market for over 300 years. Our testing shows that combining seasonality and trends gives more stable, consistent results over time. This is what we’re striving to achieve.

  • YTD Return as of 2/27/15: -1.91%
  • Current allocation: 100% S Fund as of 3/2/15
  • New Trades: IFT from 100% F Fund to 100% S Fund before noon EST on Monday, 3/2/2015

TSP Fund Performance (2/27/2015 YTD)

G Fund F Fund C Fund S Fund I Fund
0.31% 1.20% 2.58% 4.09% 7.24%

Charts

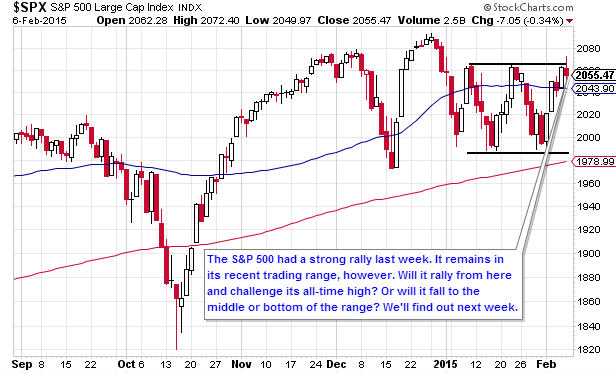
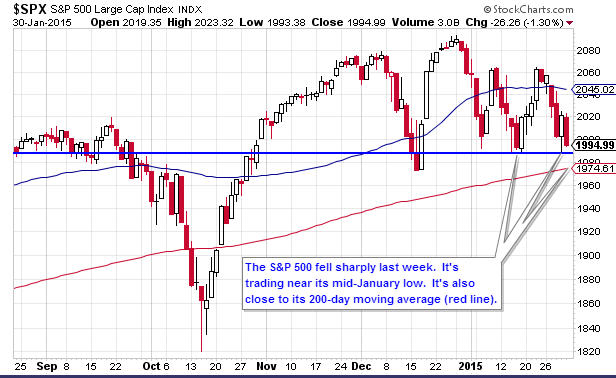
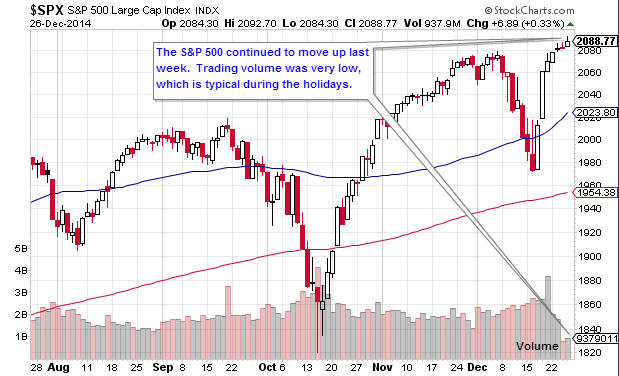
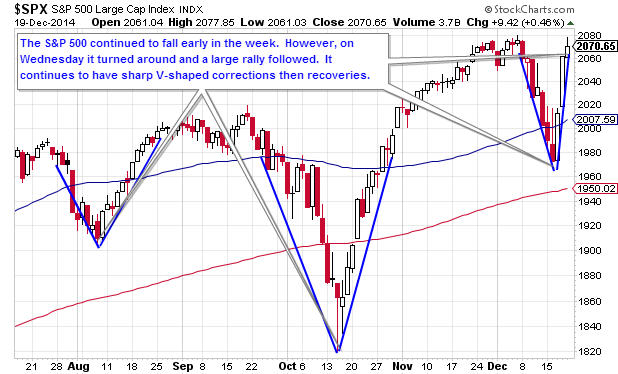
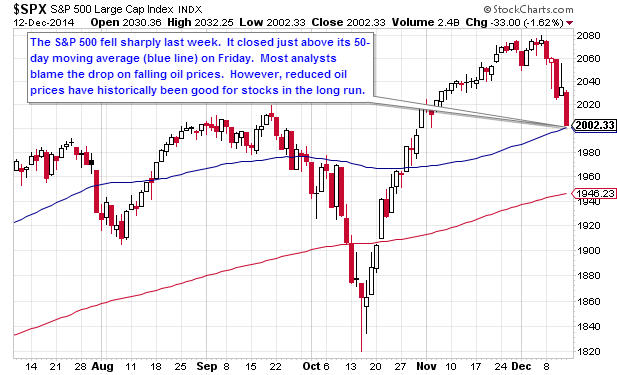
1.  Daily S&P 500 (C Fund Proxy)

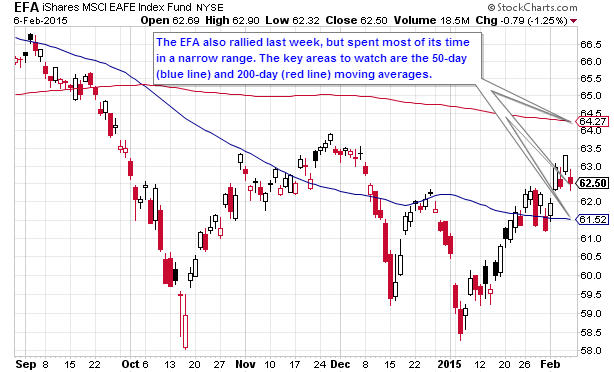
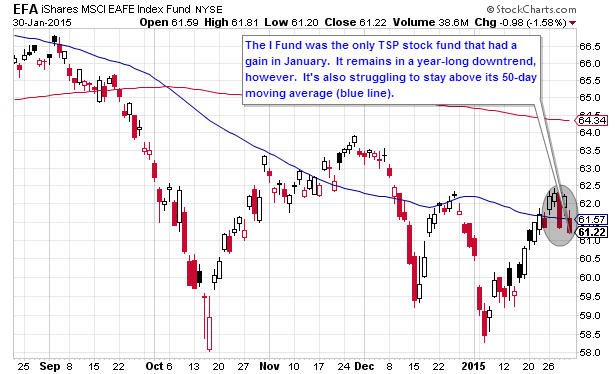
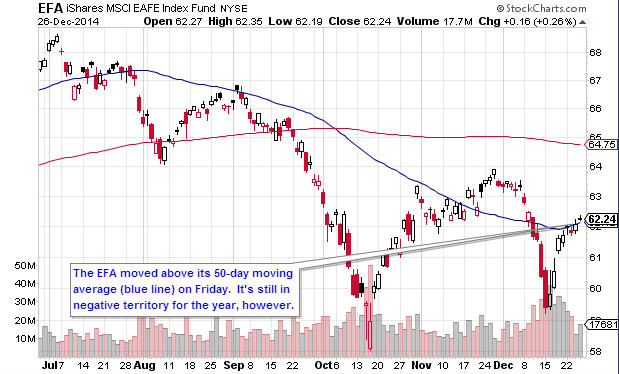
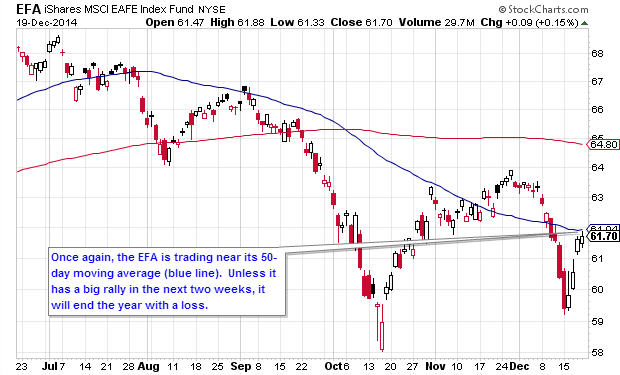
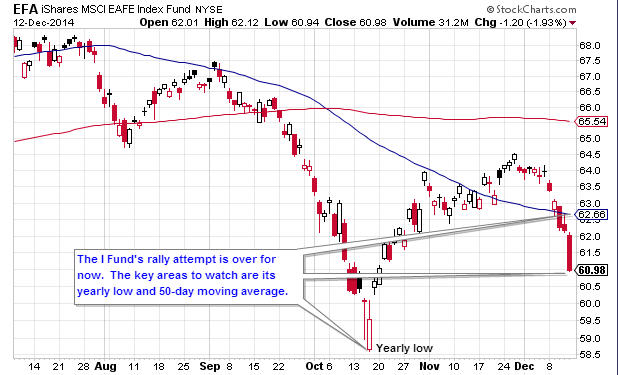
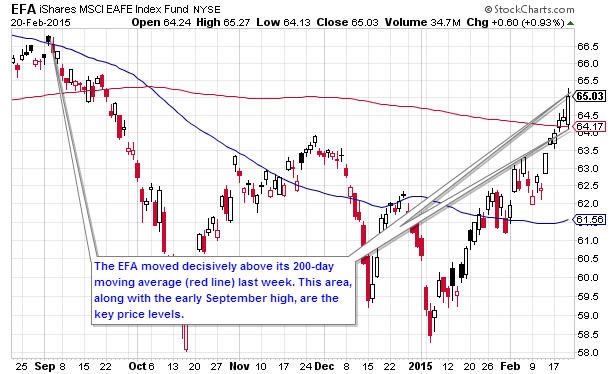
2.  Daily EFA (I Fund Proxy)

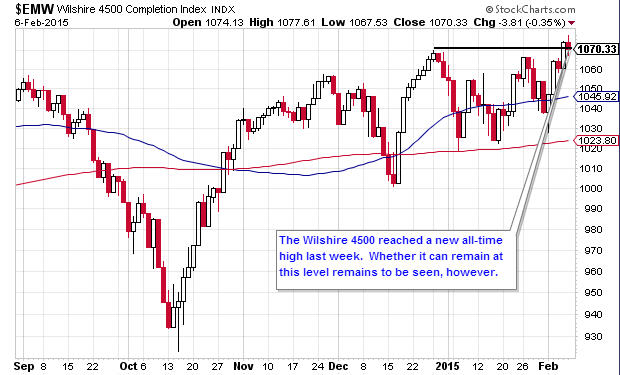
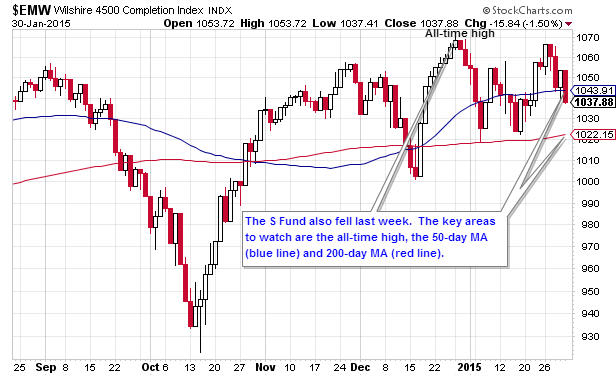
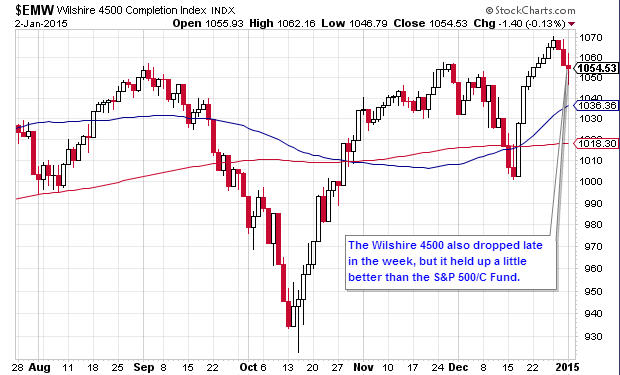
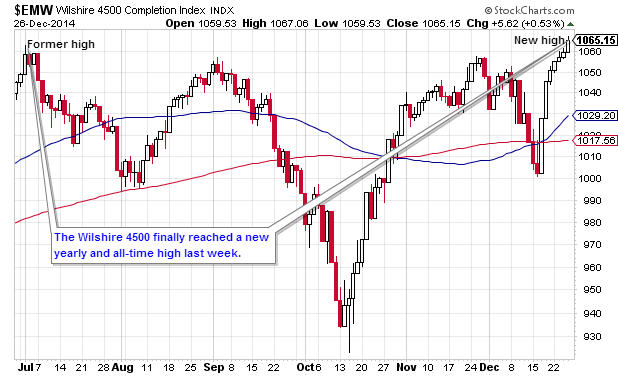
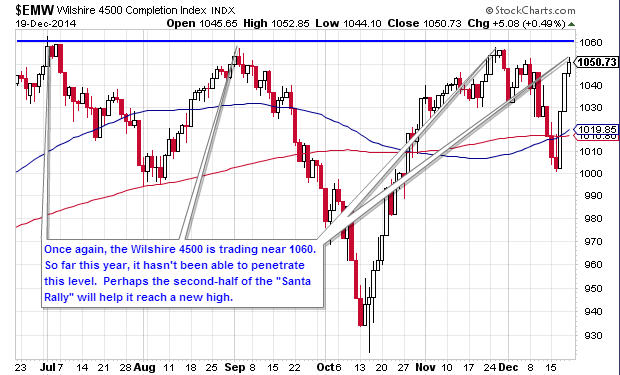
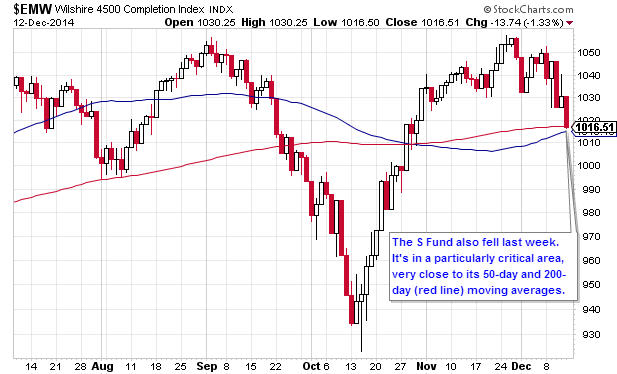
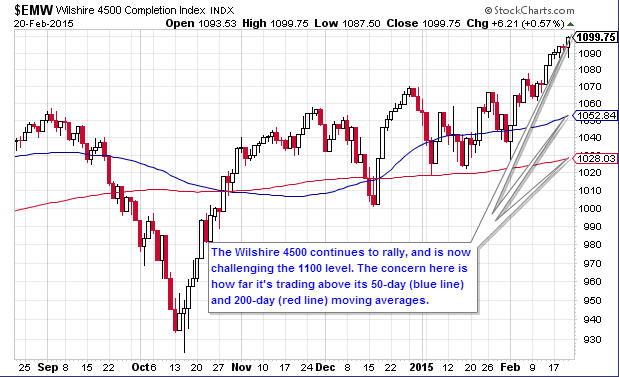
3.  Daily Wilshire 4500 (S Fund Proxy)

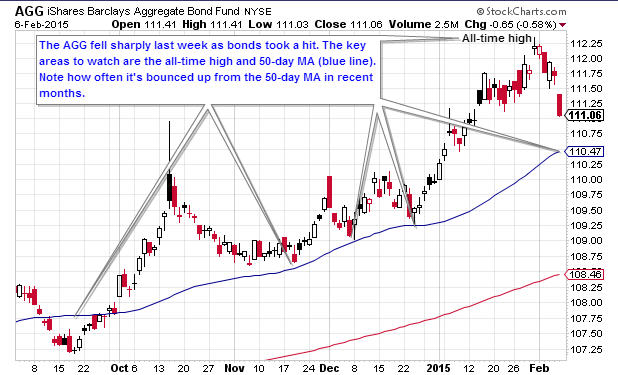
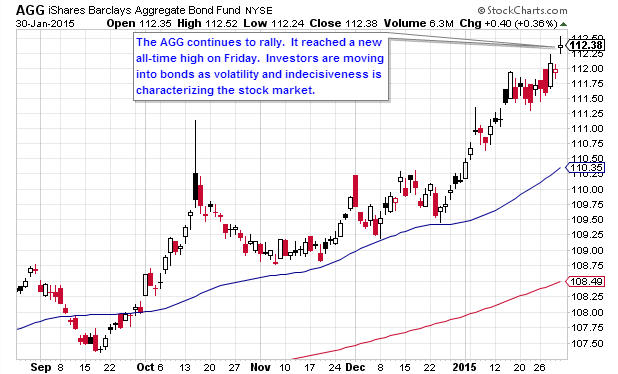
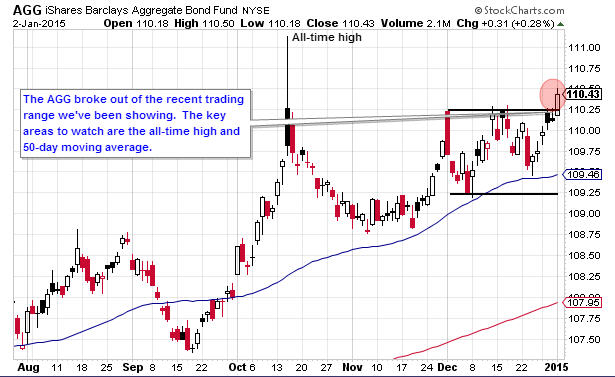
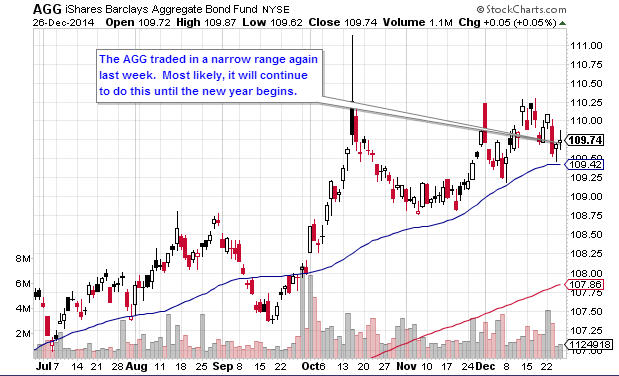
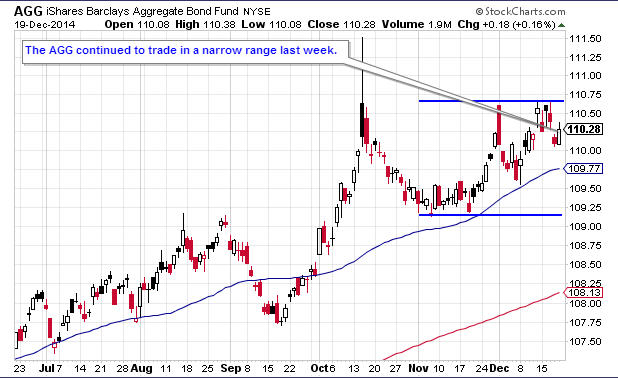
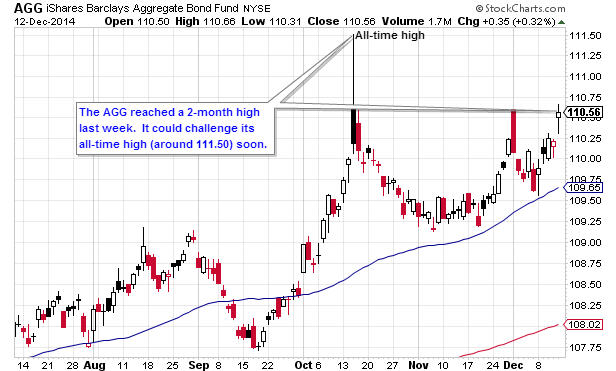
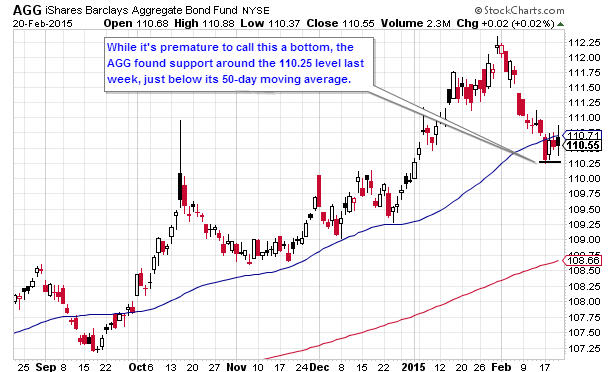
4.  Daily AGG (F Fund Proxy)

Get The Full Picture

Weekly Wrap Up

From Briefing.com
Newsletter 2/20/15

Quick Recap of the Week

Stocks rose during the holiday-shortened week. There was very little action until mid-day Friday. At that point, an announcement about Greece receiving funding sparked a rally.

As for the TSP, the I Fund led the pack again with a 2.15% gain. The S Fund rose 1.05% while the C Fund advanced by 0.68%. The F Fund fell 0.36%.

  • YTD Return as of 2/20/15: -2.60%
  • Current allocation: 100% F Fund as of 2/2/15
  • New Trades: None.

TSP Fund Performance (2/20/2015 YTD)

G Fund F Fund C Fund S Fund I Fund
0.27% 0.49% 2.83% 4.43% 6.72%

Charts

1.  Daily S&P 500 (C Fund Proxy)

2.  Daily EFA (I Fund Proxy)

3.  Daily Wilshire 4500 (S Fund Proxy)

4.  Daily AGG (F Fund Proxy)

Get The Full Picture

Weekly Wrap Up

From Briefing.com
Newsletter 2/06/15

Quick Recap of the Week

Stocks rose last week, largely in response to positive employment data.  The S Fund led the way, advancing 3.31%. It was followed by the C (3.12% gain) and I Fund (1.65% gain). After an extended run-up, bonds corrected and the F Fund fell 1.10%.

  • YTD Return as of 2/6/15: -2.01%
  • Current allocation: 100% F Fund as of 2/2/15
  • New Trades: None.

TSP Fund Performance (2/6/2015 YTD)

G Fund F Fund C Fund S Fund I Fund
0.21% 1.10% 0.03% 1.40% 2.87%

Charts

1.  Daily S&P 500 (C Fund Proxy)

2.  Daily EFA (I Fund Proxy)

3.  Daily Wilshire 4500 (S Fund Proxy)

4.  Daily AGG (F Fund Proxy)

Get The Full Picture

Weekly Wrap Up

From Briefing.com
Should You Invest in the Most Popular TSP Funds?


When it comes to investing, do you follow the herd?  Most TSP investors do.


Investopedia describes this herd instinct as a “lack of individual decision-making…causing people to think and act…as the majority of those around them.”

Popularity vs Performance

In our last two blog posts, here and here, we mentioned a recent TSP audit. It showed that TSP investors put 75% of their money into the C and G Funds.

This is clearly herd behavior. But is there a good reason for it?  Do the C and G consistently outperform other TSP funds? No—not at all.

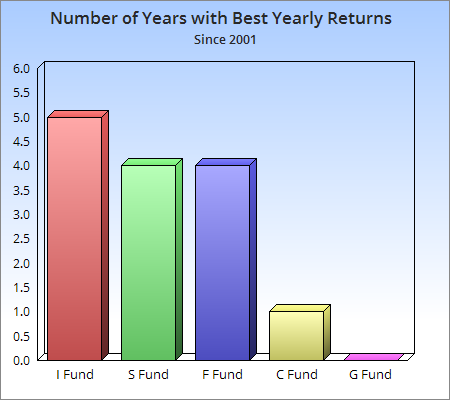
The chart below shows how many years each fund has had the highest annual return.  It starts in 2001.  We chose that year because that’s when the TSP added the I and S Funds.

Blog 4 Chart

Don’t follow the herd

The I, S and F Funds have clearly been the top performers since 2001. To its credit, the C Fund had the best return in 2014. However, this was its first “top performer award” since 1998. The G Fund hasn’t had the highest return since 1994.

Will this trend continue? No one knows. The point is that fund popularity has nothing to do with fund performance. If anything, you’d do better by going against the crowd.

And the least popular fund is…

The audit showed that the F Fund was the least popular. TSPers put ten times more money into the G Fund than into the F. Yet the F Fund outgained the G in 7 of the last 8 years.

Some people avoid the F Fund because interest rates are at historic lows. Interest rates and bond prices move in opposite directions. Therefore, it appears the F Fund has little room to move higher.

Instead of speculating on such things, it’s better to follow the trend. As long as the F Fund is moving up, it’s a logical choice when the stock funds (C,S, I) aren’t doing well.

The I Fund

The I Fund isn’t popular either. Some avoid it because it has unpredictable daily fluctuations.

This affects very short-term traders. If you hold the I Fund for a month or longer, it’s not a concern. The fluctuations cancel each other out.

So what should you do?

Does this mean we should only invest in the I, S and F Funds? Certainly not. But you shouldn’t avoid them, especially if their trends are stronger than the C and G Funds.

The moral of the story? Don’t follow the herd. Instead, follow the funds…the best-performing ones, that is.

Newsletter 1/30/15

Quick Recap of the Week

U.S. stocks fell after volatile trading last week. While financial news was mixed, uncertainty in Europe (particularly Greece) gave the bears an edge. Oil prices fell most of the week, but had a huge rally on Friday. This didn’t help stocks, however.

The C Fund had the largest loss, falling 2.75%. The S dropped by 1.63%, while the I Fund eked out a 0.27% gain. The Fund moved up by 0.62%.

  • YTD Return as of 1/30/15: -1.85%
  • Current allocation: 100% F Fund as of 2/2/14
  • New Trades: Interfund transfer and contribution allocation to 100% F Fund by noon EST on Monday, 2/2/15.

TSP Fund Performance (1/30/2015 YTD)

G Fund F Fund C Fund S Fund I Fund
0.18% 2.13% -2.99% -1.85% 1.19%

Charts

1.  Daily S&P 500 (C Fund Proxy)

2.  Daily EFA (I Fund Proxy)

3.  Daily Wilshire 4500 (S Fund Proxy)

4.  Daily AGG (F Fund Proxy)

Get The Full Picture

Weekly Wrap Up

From Briefing.com
Newsletter 1/2/15

Quick Recap of the Week

Stocks fell during another holiday-shortened week. As expected, both news and trading volume were light. Political uncertainty in Greece dragged down European stocks, however. As a result, the I Fund had the week’s largest loss of 1.54%.

The C Fund wasn’t far behind, falling 1.42%. The S Fund fell 1.04%, while the F Fund gained 0.62%.

  • YTD Return as of 1/2/15: -0.18%
  • Current allocation: 100% S Fund as of 12/29/14
  • New Trades: None.

TSP Fund Performance (1/2/2015 YTD)

G Fund F Fund C Fund S Fund I Fund
0.01% 0.18% -0.02% -0.18% 0.00%

Charts

1.  Daily S&P 500 (C Fund Proxy)

2.  Daily EFA (I Fund Proxy)

3.  Daily Wilshire 4500 (S Fund Proxy)

4.  Daily AGG (F Fund Proxy)

Get The Full Picture

Weekly Wrap Up

From Briefing.com
Newsletter 12/26/14

Quick Recap of the Week

The stock market moved up during the holiday-shortened week. While most economic data was worse-than-expected, a strong Gross Domestic Product (GDP) number boosted stocks.

As for the TSP funds, the S Fund led the way with a 1.38% gain. The C moved up 0.90% while the I Fund advanced by 0.47%. The F fund dropped by 0.19%.

  • YTD Return as of 12/26/14: 3.73%
  • Current allocation: 100% S Fund as of 12/29/14
  • New Trades: Do interfund transfer and change contribution allocation to 100% S Fund before noon EST on 12/29/2014.

TSP Fund Performance (12/26/2014 YTD)

G Fund F Fund C Fund S Fund I Fund
2.28% 6.27% 15.40% 8.74% -3.79%

Charts

1.  Daily S&P 500 (C Fund Proxy)

2.  Daily EFA (I Fund Proxy)

3.  Daily Wilshire 4500 (S Fund Proxy)

4.  Daily AGG (F Fund Proxy)

Get The Full Picture

Weekly Wrap Up

From Briefing.com
Newsletter 12/19/14

Quick Recap of the Week

As the week began, stocks continued their recent fall. They started recovering on Wednesday, though, after the Federal Reserve released their latest policy statement. The Fed indicated they’d be flexible regarding future rate hikes. This set off a large rally over the next three days. Oil prices also started to stabilize.

The S and C Funds led the way, gaining 3.53% and 3.44%, respectively. The I Fund moved up 1.57% while the F Fund fell 0.26%.

  • YTD Return as of 12/19/14: 2.81%
  • Current allocation: 100% C Fund as of 11/3/14
  • New Trades: None

TSP Fund Performance (12/19/2014 YTD)

G Fund F Fund C Fund S Fund I Fund
2.24% 6.47% 14.37% 7.25% -4.24%

Charts

1.  Daily S&P 500 (C Fund Proxy)

2.  Daily EFA (I Fund Proxy)

3.  Daily Wilshire 4500 (S Fund Proxy)

4.  Daily AGG (F Fund Proxy)

Get The Full Picture

Weekly Wrap Up

From Briefing.com
Newsletter 12/13/14

Quick Recap of the Week

Stocks fell last week. Most analysts placed the blame on falling oil prices. However, poor economic data from China and Japan added to the negativity early in the week. Most U.S. data came in better-than-expected, however. This included retail sales, unemployment claims and consumer sentiment.

The I Fund took the biggest hit among TSP funds, dropping 4.20%. The C Fund (3.47% losss) and S Fund (3.07% loss) followed. The F Fund gained 0.73% as traders moved to bonds for safety.

As for falling oil prices, this is actually a good thing for stocks in the long run. In the short-term, oil price “shocks” may scare investors.  However, an academic study showed an inverse correlation between oil prices and stock prices.

  • YTD Return as of 12/13/14: -0.61%
  • Current allocation: 100% C Fund as of 11/3/14
  • New Trades: None

TSP Fund Performance (12/13/2014 YTD)

G Fund F Fund C Fund S Fund I Fund
2.20% 6.75% 10.56% 3.60% -5.72%

Charts

1.  Daily S&P 500 (C Fund Proxy)

2.  Daily EFA (I Fund Proxy)

3.  Daily Wilshire 4500 (S Fund Proxy)

4.  Daily AGG (F Fund Proxy)

Get The Full Picture

Weekly Wrap Up

From Briefing.com
To G or not to G

An investment that doesn’t lose money is attractive. This is especially true for conservative investors. And after two devastating bear markets within 10 years, many investors are more conservative. This is why the G Fund is so popular. There’s no risk of losing your money in it. Unfortunately, its popularity comes with a cost.

A cost? Wait, but the G Fund can’t lose money? We’ll get to that in a moment.

Most popular fund

As noted in our last articlethe G Fund is the most popular TSP fund.  An end-of-2013 audit found that nearly 45% of TSP assets were in the G. That’s more than twice the amount in the S and I Funds combined.

This would make sense in a stock market crash. But the end of 2013? After two straight years of the C, S and I Funds making double-digit gains?

What’s more, people in their 20s have higher G Fund allocations than those in their 50s. That’s according to Federal News Radio, quoting a memo from the TSP’s executive director.

Still, you may wonder “What’s wrong with this? The G’s return is pretty low, but there’s no real risk, right?” The problem is what economists call an opportunity cost. An opportunity cost is what you give up when you make a choice.

You can’t have it both ways

An example should make this clear. Say you budget $20 for dining out and entertainment on Saturday. You spend it on a movie and snacks in the afternoon. That evening, you get hungry and crave pizza. You wonder if you should’ve saved the $20 for dinner. What’s your opportunity cost? It’s the pizza you couldn’t buy for dinner. You gave up this “opportunity” when you splurged in the afternoon.

Let’s apply this to investments. Assume you have $10,000 in your TSP account and a 100% G Fund allocation. You consider using a more aggressive strategy. Instead, you stay fully invested in the G Fund.

Eight years later, you realize the aggressive strategy would’ve doubled your account. Your account balance could be $20,000. Instead, you only have $12,000. That’s an $8,000 difference, and it’s your opportunity cost. That’s a big price to pay to “conserve” your money.

Retirement plans aren’t emergency funds

Ultra-conservative investing is smart in some situations. If you have an emergency fund, don’t take big risks with it. A long-term retirement plan is different, though. It can compound and grow over decades. A large, permanent allocation in the G Fund has a tremendous opportunity cost.

Is the G Fund ever appropriate? Sure. During bear markets, the G and F Funds are the best places for your money. But when stocks are moving up, you want to follow the trend.

The G Fund is a valuable tool. You just need to know when to use it. If overused or employed at the wrong time, it can be very costly.