Tag Archives: TSP

2019 in Review

2019 was a banner year for the stock market. The TSP stock funds had gains of 22.47% (I Fund), 27.97% (S Fund) and 31.45% (C Fund).

TSPKey’s performance

It was a good year for our service. Our 28.31% return was higher than 9 of the 10 TSP funds, including all of the L Funds.

We also outperformed the 6 other professional services tracked by TSPCenter (based on their 1-year returns as of 12/31/2019) and TSPTalk’s advisory services.

A better comparison

A 100% stock fund allocation isn’t the best “apples to apples” comparison for our service. We weren’t fully invested in stock funds all of last year. Our average daily allocation was 81% in stock funds. The rest was split between the G and F Funds.

The L 2050 Fund is a better benchmark. It’s invested 81.75% in stock funds, almost identical to ours. The L 2050 had a 23.33% gain last year, so our return was decidedly higher.

Let’s assume someone was really lucky and guessed the C Fund would be 2019’s top performer. If they invested 81% in C and split the rest between the F and G Funds, the return would be 26.23%, still lower than ours at the same risk level.

Lessons learned

There are a few major takeaways from 2019:

Lesson 1: Don’t fight the trend

“The trend is your friend” is an old Wall Street adage, and the trend for stocks was up in 2019. If you kept a large allocation in the G and F Funds, you missed a great opportunity.

Lesson 2: Don’t fear the bear

Despite the stock rally, there was no shortage of scary news. Gloomy headlines about trade wars, international tensions and impeachment were everywhere. Many analysts–including some TSP services–predicted a recession or market crash. If you followed their advice and moved out of stocks, you also missed out.

Lesson 3: Make decisions based on data, not emotions

Is there ever a time to reduce your stock allocation? Yes, but only when you use clear, tested rules and hard data–not headlines and gloomy predictions. Our system uses three criteria:

  • The stock market’s long-term trend
  • An economic data index (manufacturing, housing, employment, yield curve, etc.). If the long-term trend turns down, is it temporary or is a real recession on the horizon? This index keeps us in stocks during short-term disruptions when the economy is still sound. It’s better to hold some stock funds unless a true, long-term bear market happens.
  • Seasonality. Historically the stock market performs better during certain times of the year.

These are binary (yes or no) indicators telling us to invest fully, partially or not at all in stock funds. They remove emotions and biases.

Right now the market’s long-term trend is up. Our economic data index is positive, though it’s weakened a bit recently.

Wrapping Up

Whether you use our service or not, we hope this will help optimize your TSP account and other investments. In summary:

  • Keep a higher allocation of stock funds when the market is trending up
  • Don’t change your investing plan based on news, hype or fear
  • Use rule-based systems and principles to manage your investments

Join us!

Need help allocating your TSP funds? Become a TSPKey member here. You’ll get our TSP specific fund recommendations and weekly newsletter.

TSPKey does not give personalized investment advice. This is for informational and educational purposes only. Past and/or hypothetical performance is not an indication of future performance.

Investing Outside the TSP: Real Estate

Many TSP account holders also invest through brokerage accounts and IRAs. Because of this, we’ve decided to cover some investing ideas outside of the TSP.

In this blog, we’ll go over one of our favorite real estate investments. Before getting started, a standard disclaimer applies: we don’t give personalized advice. Investments discussed in this blog may not be suitable for you. Please perform your own due diligence.

Real Estate Through Your Stock Broker

When most people think of real estate, rental properties come to mind. Rental houses can be profitable, but also have plenty of headaches: non-paying tenants, maintenance,  phone calls at 3 AM about broken toilets, etc.

We’re going to talk about something very different–a real estate investment trust (REIT) in the commercial real estate space. Realty Income (ticker symbol “O”) is our favorite REIT. You can invest in it through any stock broker.

Realty Income is well diversified, owning property in 47 industries across 49 states. Some of its biggest tenants are Walgreens, FedEx and Dollar General.

Realty Income is very popular among dividend investors. In fact, it’s known as the “Monthly Dividend Company.” It’s paid 560 consecutive monthly dividends since it began in 1969. And it’s increased its quarterly dividend for 78 straight quarters.

More than dividends

Dividends are only part of the story, however. Some stocks pay large dividends while their prices fall. The ideal dividend stock has strong, growing dividends along with capital appreciation (i.e., rising stock prices).

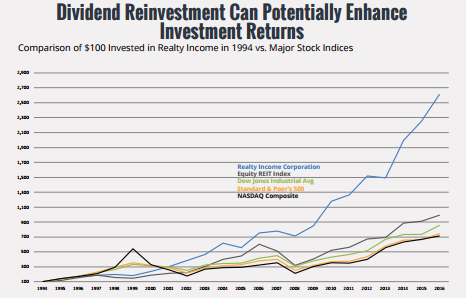
This has certainly been the case with Realty Income. The chart compares it to several major indexes, including the REIT index:

Source

Of course, there’s no guarantee that Realty Income will perform this well in the future. And rising interest rates could harm it along with other real estate investments. However, it’s performed well historically in various interest rate environments.

Crashes, Yields and Entry Points

Realty Income survived the financial crisis that devastated much of the real estate market. It fell just over 40% from late 2007 to its 2009 bottom. It recovered quickly and reached a new all-time high in early 2010. By contrast, the S&P 500 didn’t reach a new high until 2013.

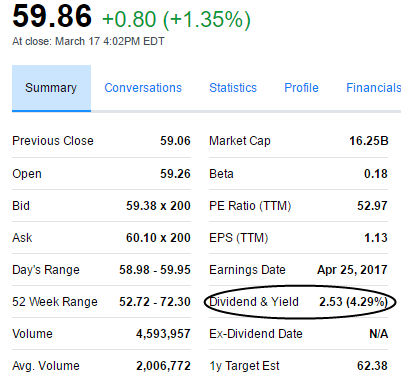
Realty Income fell after the 2016 election on fears of interest rate increases. As of March 17, its price is 59.86, down about 15% from its all-time high. Its current dividend yield is 4.29%.

While 4.29% is an attractive yield, we believe it’s ideal to buy Realty Income when its yield is closer to 5%. This will require a more significant price drop like there was in August 2015. If this happens, we plan to write a follow-up blog.

Finding the yield and more information

You can find the yield of Realty Income by typing the ticker symbol “O” in Yahoo Finance.  You’ll see a “Summary” section like this:

Below are a few more links about Realty Income.

How Risky is Realty Income Corporation? (Motley Fool)
Let Realty Income Corp (O) Pay Your Bills in 2017 (InvestorPlace)
Best of the Best Monthly Dividend Stocks (Sure Dividend)

A final note: we don’t recommend investing more than 5% of your portfolio in any stock or fund, unless it’s a broad index fund like the S&P 500. Allocating too much into any sector (real estate, biotech, commodities, etc.) is risky.

Join us!

If you’d like to learn more about our service, sign up here. You’ll also receive our free TSP resource guide and two TSP strategies.

Disclosure: As of the time of the blog (3/18/2017), we own shares of Realty Income (O). Besides being shareholders we have no affiliation with the company.

Why You Should Never Buy and Hold in a Market Crash (Market Timing Part 3)

Some investing concepts are obvious. For example, if you want really high returns, you’ll probably have to take a lot of risk.

Other concepts aren’t as intuitive. Consider compound interest. The ability for money to grow through compounding is rather amazing. Albert Einstein reportedly called it the greatest mathematical discovery of all time.”

A drawdown is another concept that’s not so obvious. Drawdowns measure how much your account falls from a high point to a low point. While the concept is simple, the way drawdowns affect investments surprises many people.

An example

Let’s say your TSP account reached a peak of $10,000 in 2007. Then it fell to a low of $7,000 in 2009 before recovering. Your drawdown is 30% (the $3,000 loss divided by the high point of $10,000).

To grow your account back to $10,000, how much do you need to gain? Another 30%? No. You actually need a 43% increase. This is why drawdowns are so important. It can take years—or even decades—to recover from a large one.

The 50% drawdown…that happened twice in 7 years

What about a 50% drawdown? It’s happened to countless investors. The S&P 500 fell 49% from 2000 to 2002. Then it dropped 56% from 2007 to 2009.

After a 50% drawdown, you need a 100% gain to recover your loss. This is no easy task. After the S&P 500 peaked in 2000, it took over 7 years to reach its previous high.

When it finally reached this new high in October 2007, the stock market crashed again.

Although stocks rallied after the 2008 financial crisis, it took the S&P 500 another 6 years to fully recover. It really gets ugly when you consider both crashes. From 2000 to 2013, you’d have almost no gain from buying and holding the S&P 500.

The bigger the drawdown, the longer the recovery

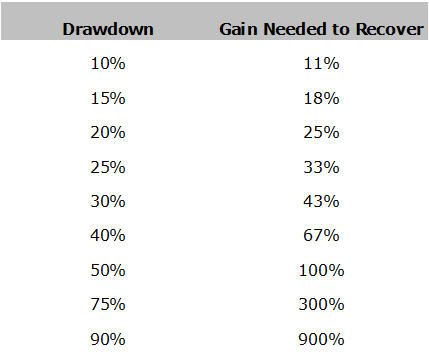
Max DD Blog 7 GraphicThe table below reveals the surprising truth about drawdowns. It’s not too hard to recover from small losses. A 15% drawdown only requires an 18% recovery. A 25% drawdown is worse, requiring a 33% gain. This isn’t unreasonable, though. Stocks often rally this much within a year or two after a bear market.

Avoid the largest drawdowns

As drawdowns increase, the “Gain Needed to Recover” increases exponentially. When drawdowns reach 40%, you get into dangerous territory. If you’re near retirement, you may never recoup your loss.The real worst-case scenarios

The 2000-2002 and 2007-2009 stock crashes were devastating for some investors. This is especially true for those who sold stocks near the bottom and never reinvested in them. The “Lost Decade” (2000-2009) isn’t the worst thing to happen in the last century, however.

The Great Depression

The Dow Jones Industrial Average fell 90% during the first 4 years of the Great Depression. It took 25 years to return to its pre-Depression peak. Are we predicting another a crash like this? No, but remember, anything is possible in the financial markets.

Meanwhile in Japan

Japan’s stock index, the Nikkei, peaked in 1989 at around 40,000. Right now, it’s trading close to 20,000. After 25 years, it’s still trading 50% below its all-time high. Buy and hold has been a terrible strategy for that index.The “tech wreck’s” 15-year recovery

After peaking in March 2000, the Nasdaq fell over 80%. It didn’t reach a new high until very recently—April 2015. Once again, we see how devastating a large drawdown can be.

The common theme

What do these drawdowns have in common? They assume you buy-and-hold. Instead of exiting the market during corrections, buy-and-holders sit through the worst crashes. They may wait years to recoup their losses. Fortunately, you don’t have to do this. There is another way.

To G or not to G

An investment that doesn’t lose money is attractive. This is especially true for conservative investors. And after two devastating bear markets within 10 years, many investors are more conservative. This is why the G Fund is so popular. There’s no risk of losing your money in it. Unfortunately, its popularity comes with a cost.

A cost? Wait, but the G Fund can’t lose money? We’ll get to that in a moment.

Most popular fund

As noted in our last articlethe G Fund is the most popular TSP fund.  An end-of-2013 audit found that nearly 45% of TSP assets were in the G. That’s more than twice the amount in the S and I Funds combined.

This would make sense in a stock market crash. But the end of 2013? After two straight years of the C, S and I Funds making double-digit gains?

What’s more, people in their 20s have higher G Fund allocations than those in their 50s. That’s according to Federal News Radio, quoting a memo from the TSP’s executive director.

Still, you may wonder “What’s wrong with this? The G’s return is pretty low, but there’s no real risk, right?” The problem is what economists call an opportunity cost. An opportunity cost is what you give up when you make a choice.

You can’t have it both ways

An example should make this clear. Say you budget $20 for dining out and entertainment on Saturday. You spend it on a movie and snacks in the afternoon. That evening, you get hungry and crave pizza. You wonder if you should’ve saved the $20 for dinner. What’s your opportunity cost? It’s the pizza you couldn’t buy for dinner. You gave up this “opportunity” when you splurged in the afternoon.

Let’s apply this to investments. Assume you have $10,000 in your TSP account and a 100% G Fund allocation. You consider using a more aggressive strategy. Instead, you stay fully invested in the G Fund.

Eight years later, you realize the aggressive strategy would’ve doubled your account. Your account balance could be $20,000. Instead, you only have $12,000. That’s an $8,000 difference, and it’s your opportunity cost. That’s a big price to pay to “conserve” your money.

Retirement plans aren’t emergency funds

Ultra-conservative investing is smart in some situations. If you have an emergency fund, don’t take big risks with it. A long-term retirement plan is different, though. It can compound and grow over decades. A large, permanent allocation in the G Fund has a tremendous opportunity cost.

Is the G Fund ever appropriate? Sure. During bear markets, the G and F Funds are the best places for your money. But when stocks are moving up, you want to follow the trend.

The G Fund is a valuable tool. You just need to know when to use it. If overused or employed at the wrong time, it can be very costly.