Tag Archives: TSP Funds

Newsletter 12/5/14

Quick Recap of the Week

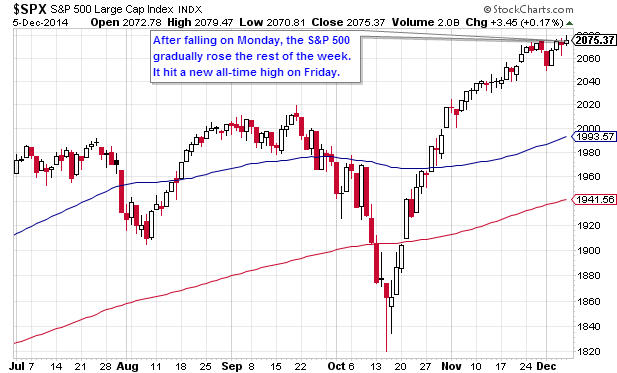
Last week began with a stock market decline on Monday. For the rest of the week, stocks clawed their way back up. Economic data was generally positive. The ISM Manufacturing and Non-Farm Employment Change (“jobs report”) were better than expected.

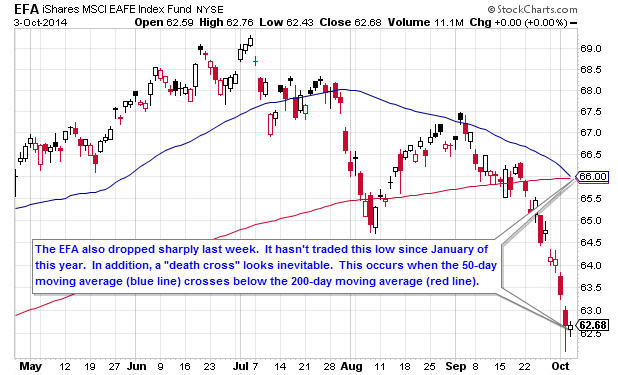
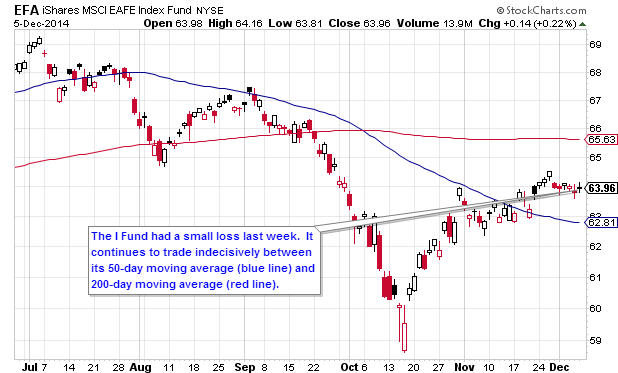
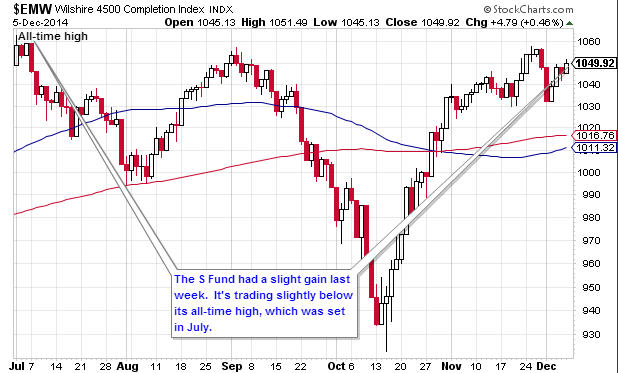
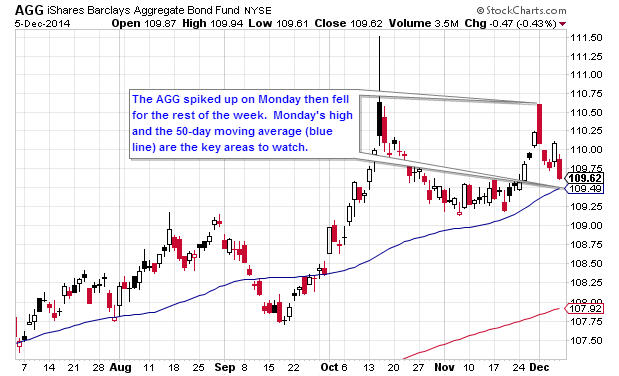
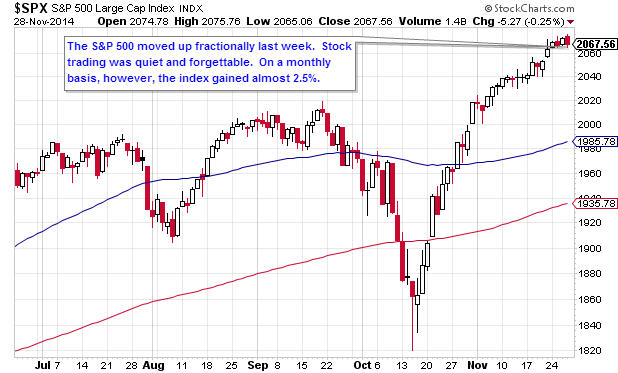
As for the TSP, the C Fund had the best week with a 0.42% gain. It was followed by the S Fund, which advanced 0.13%. The I and F Funds both lost ground, falling by 0.40% and 0.51%, respectively.

  • YTD Return as of 12/5/14: 2.96%
  • Current allocation: 100% C Fund as of 11/3/14
  • New Trades: None

TSP Fund Performance (12/5/2014 YTD)

G Fund F Fund C Fund S Fund I Fund
2.16% 5.97% 14.54% 6.88% -1.58%

Charts

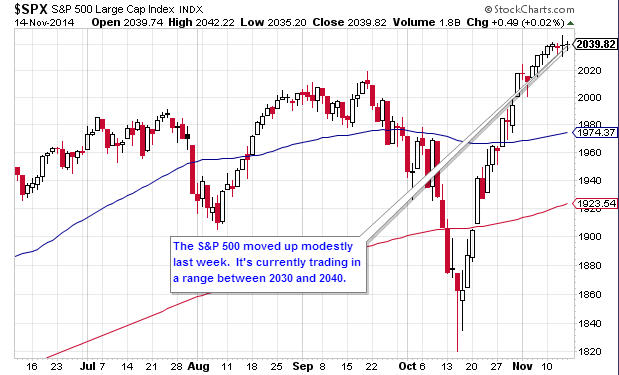
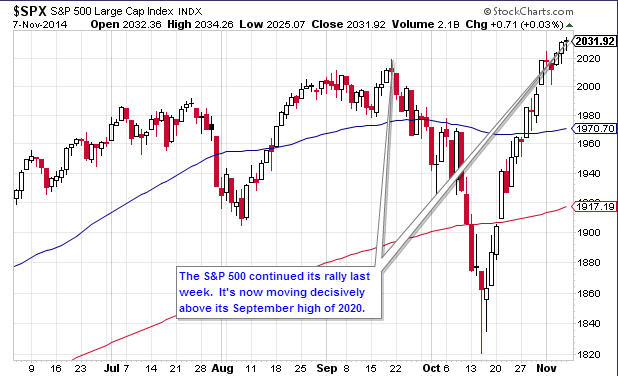
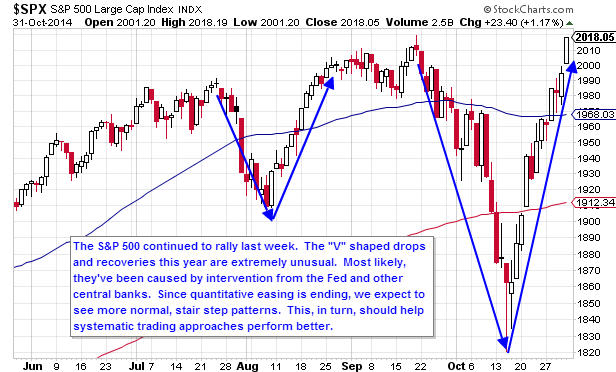
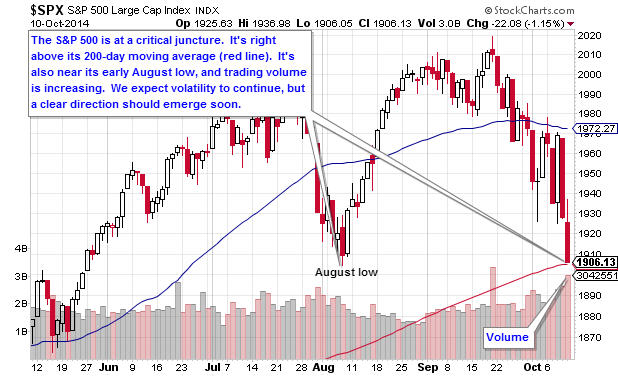
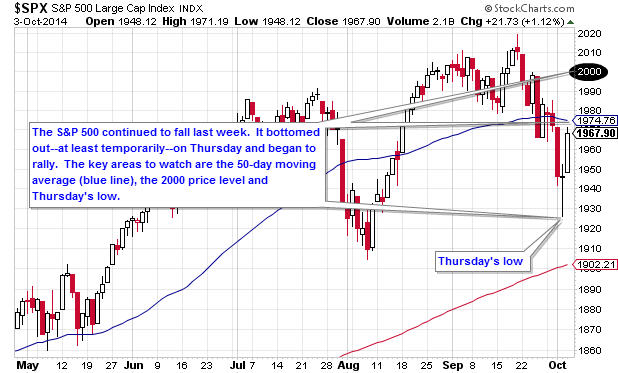
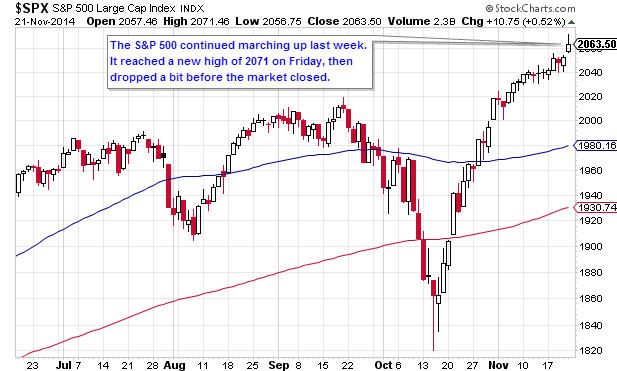
1.  Daily S&P 500 (C Fund Proxy)

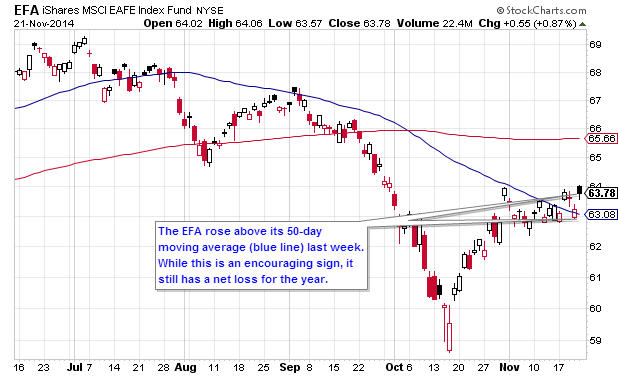
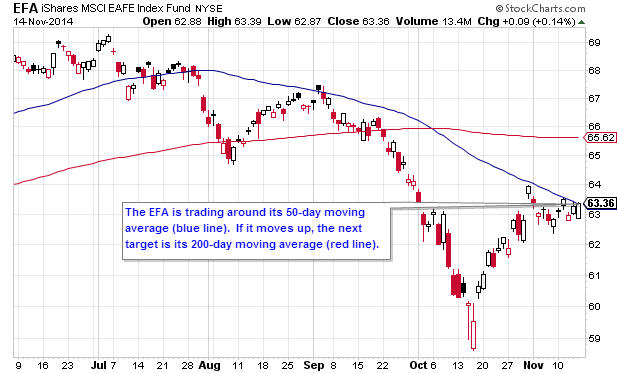
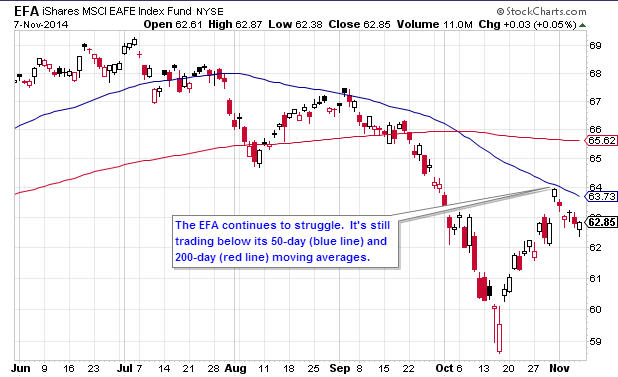
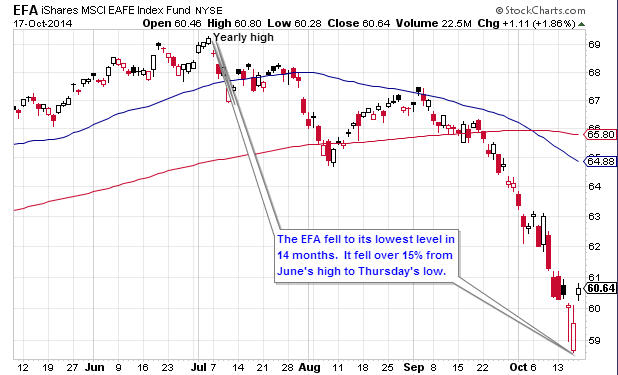
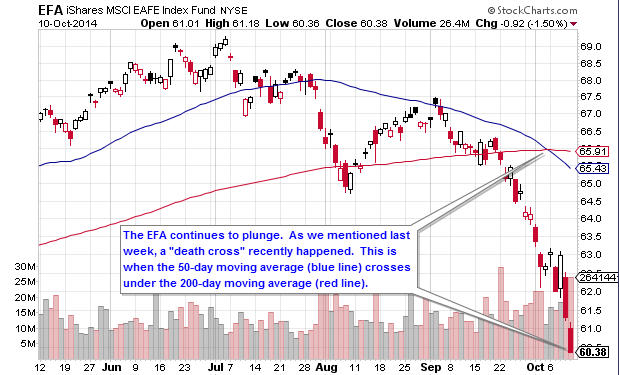
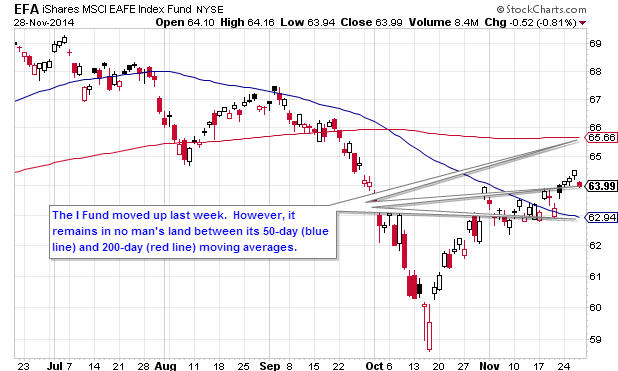
2.  Daily EFA (I Fund Proxy)

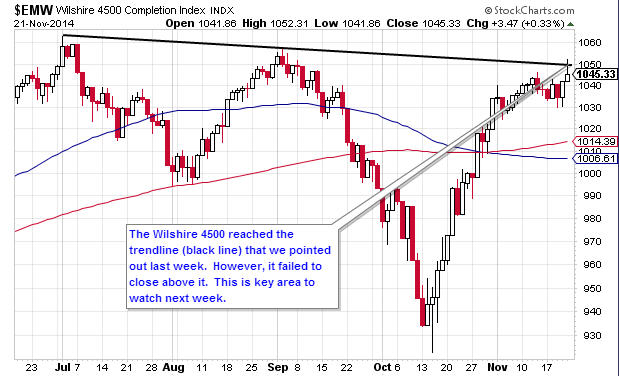
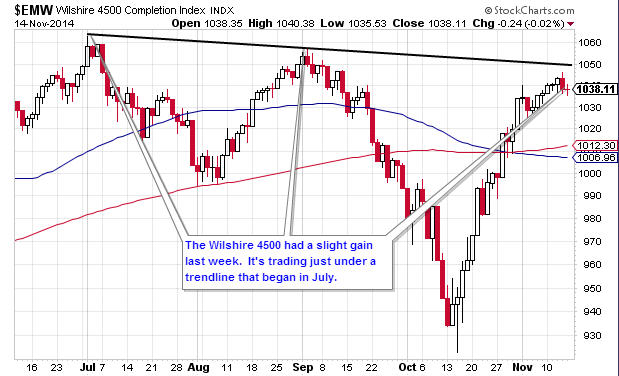
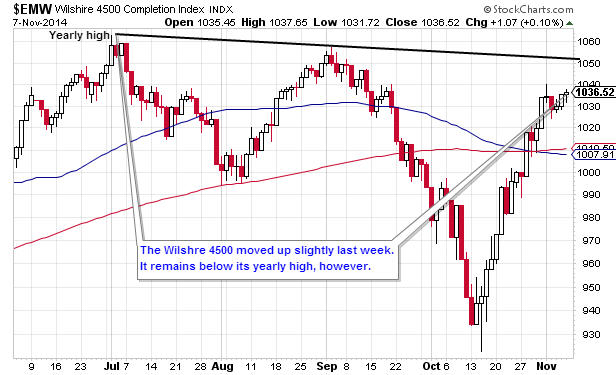
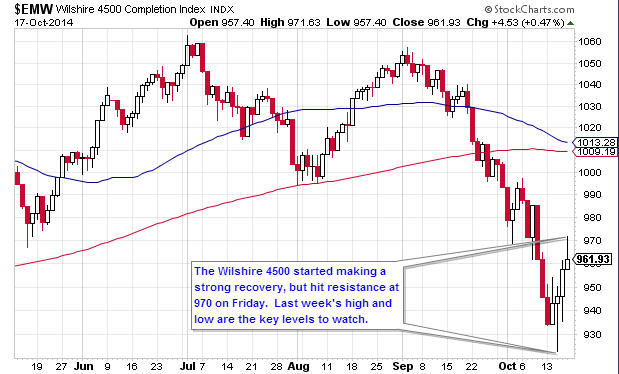
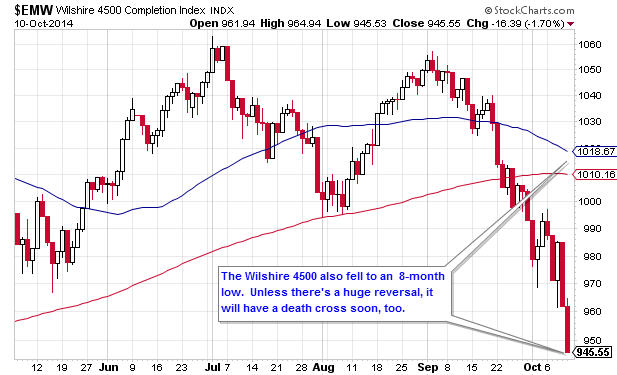
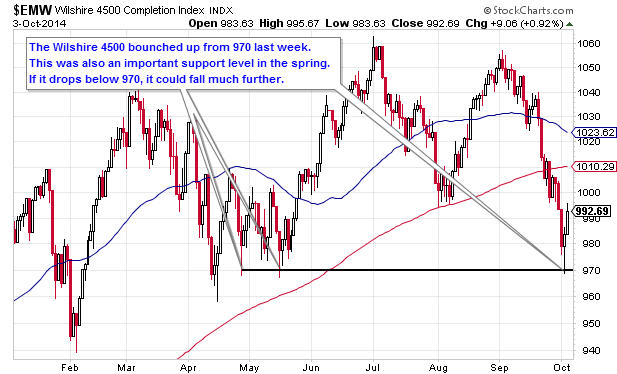
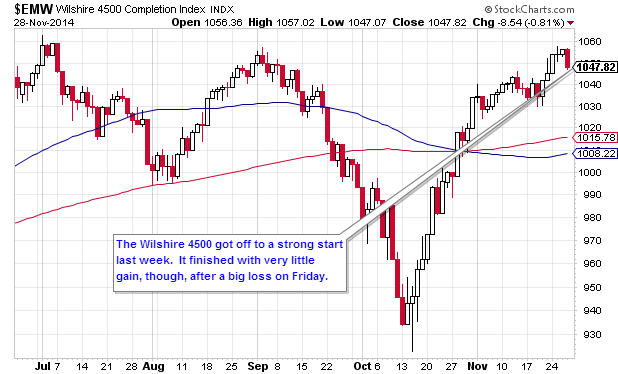
3.  Daily Wilshire 4500 (S Fund Proxy)

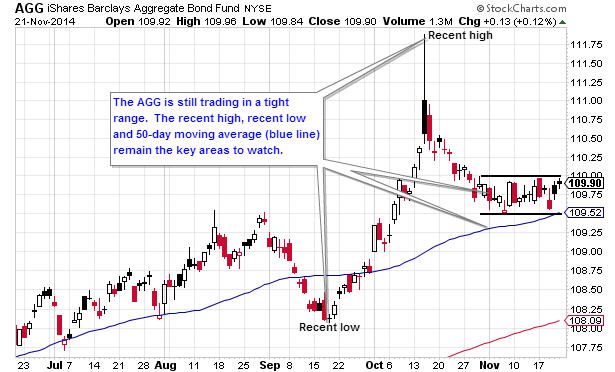
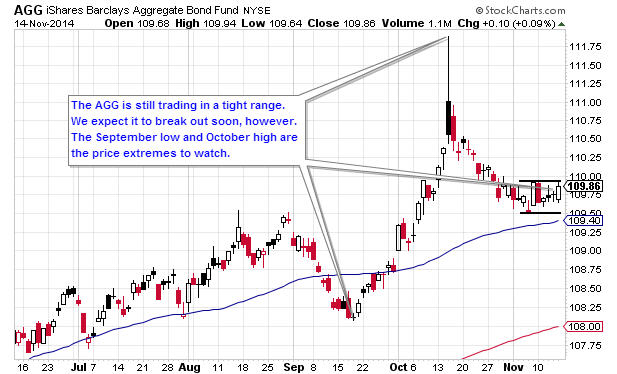
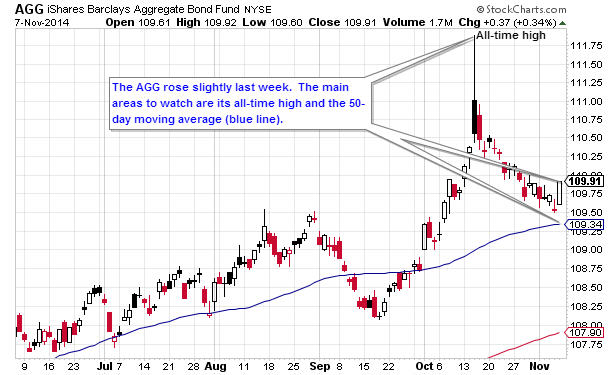
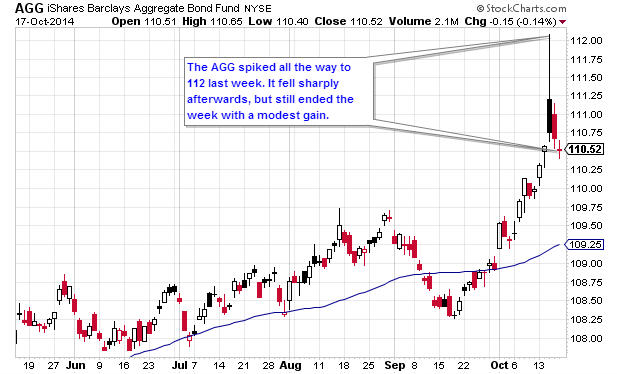
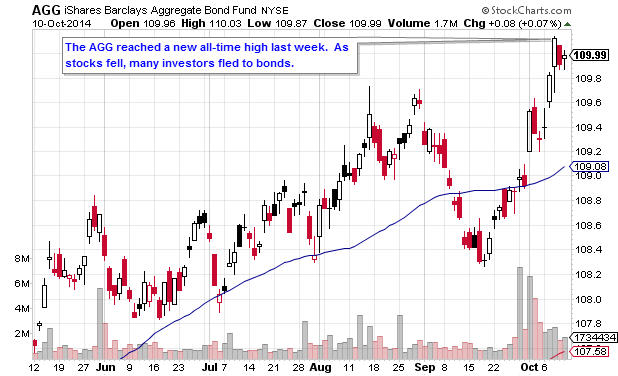
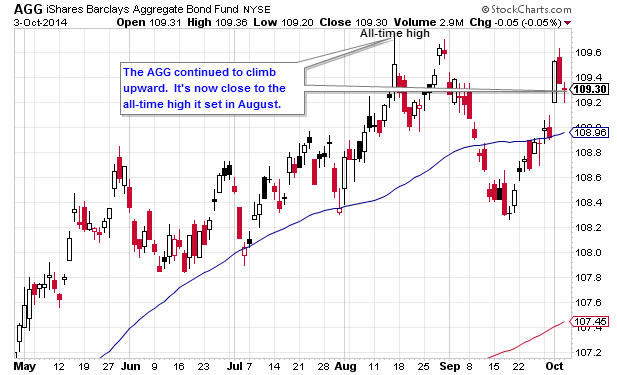
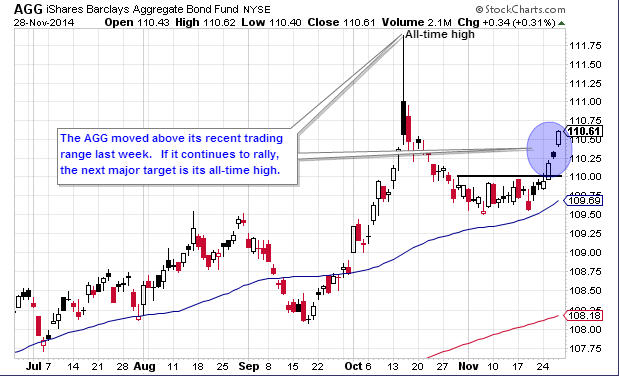
4.  Daily AGG (F Fund Proxy)

Get The Full Picture

Weekly Wrap Up

From Briefing.com
Newsletter 11/28/14

Quick Recap of the Week

The holiday-shortened week was mostly uneventful for the financial markets.  It started with a modest rally early in the week.  However, big losses in energy stocks caused the broader market to drop on Friday.  As for the TSP, the F Fund led the way with a 0.56% gain.  It was followed by the I Fund, which advanced 0.47%.  The C and S Funds moved up 0.24% and 0.17%, respectively.

  • YTD Return as of 11/28/14: 2.53%
  • Current allocation: 100% C Fund as of 11/3/14
  • New Trades: None

TSP Fund Performance (11/28/2014 YTD)

G Fund F Fund C Fund S Fund I Fund
2.12% 6.52% 14.06% 6.74% -1.19%

Charts

1.  Daily S&P 500 (C Fund Proxy)

2.  Daily EFA (I Fund Proxy)

3.  Daily Wilshire 4500 (S Fund Proxy)

4.  Daily AGG (F Fund Proxy)

Get The Full Picture

Weekly Wrap Up

From Briefing.com
Newsletter 11/21/14

Quick Recap of the Week

It was another good week for stocks. In the TSP world, the C Fund was the best performer, moving up 1.21%. The I Fund gained 1.03% while the S Fund rose by 0.64%. The bond market remained flat, however, as the F Fund only advanced by 0.09%.

Around this time of year, there’s a lot of talk about the so-called “Santa Rally.” Unfortunately, the discussion is often muddled. What exactly is the Santa Rally? When does it start? When does it end?

When it come to investing, we like to define things precisely and mechanically. Here’s our definition of the Santa Rally:

On the Monday before Thanksgiving, invest 100% of your funds in the S&P 500 at the market’s close.

On the third trading day in January, sell 100% of your S&P 500 holdings at the market’s close.

We tested this strategy from 1970 to 2013. Here’s what we found:

  • 80% of the time, the “Santa Rally” was a winning trade.
  • The average trade gained 3.01%.
  • During these trades, the S&P 500 had a compound annual return of 28.37%. During the entire period of 1970-2013, the S&P’s compound annual return was 6.93%. Compared to the entire year, stocks gained over 4 times as much during this period.
  • The maximum drawdown (largest loss) was 10.77%.

Our conclusion?  During the period that’s roughly between Thanksgiving and New Year’s Day, stocks perform much better than they do the rest of the year.  It’s not a perfect or guaranteed strategy, but nothing is in the investment world.

  • YTD Return as of 11/21/14: 2.29%
  • Current allocation: 100% C Fund as of 11/3/14
  • New Trades: None

TSP Fund Performance (11/21/2014 YTD)

G Fund F Fund C Fund S Fund I Fund
2.08% 5.92% 13.79% 6.56% -1.68%

Charts

1.  Daily S&P 500 (C Fund Proxy)

2.  Daily EFA (I Fund Proxy)

3.  Daily Wilshire 4500 (S Fund Proxy)

4.  Daily AGG (F Fund Proxy)

Get The Full Picture

Weekly Wrap Up

From Briefing.com
Newsletter 11/14/14

Quick Recap of the Week

Last week, stocks moved up slightly in a quiet week of trading. There were a few important economic data items, like Retail Sales and Consumer Sentiment. However, their better-than-expected results had little impact on the markets.

The I Fund had the best return, gaining 0.87%. Following it were the C Fund with a 0.45% increase and the S Fund, which advanced 0.27%. The F Fund was flat, moving up a negligible 0.01%.

  • YTD Return as of 11/14/14: 1.06%
  • Current allocation: 100% C Fund as of 11/3/14
  • New Trades: None

TSP Fund Performance (11/14/2014 YTD)

G Fund F Fund C Fund S Fund I Fund
2.04% 5.83% 12.43% 5.88% -2.65%

Charts

1.  Daily S&P 500 (C Fund Proxy)

2.  Daily EFA (I Fund Proxy)

3.  Daily Wilshire 4500 (S Fund Proxy)

4.  Daily AGG (F Fund Proxy)

Get The Full Picture

Weekly Wrap Up

From Briefing.com
Newsletter 11/7/14

Quick Recap of the Week

The stock market had mixed results and a relatively quiet week. The biggest data release was the nonfarm payrolls or “jobs report” on Friday. The number of new jobs was slightly-less-than-expected. This had little impact on the markets, however.

As for the TSP, the C Fund led the way with a gain of 0.78%. It was followed by the S Fund’s 0.25% increase. The F Fund had a fractional 0.08% gain, while the I Fund fell 1.84%.

  • YTD Return as of 11/7/14: 0.61%
  • Current allocation: 100% C Fund as of 11/3/14
  • New Trades: None

TSP Fund Performance (11/7/2014 YTD)

G Fund F Fund C Fund S Fund I Fund
1.99% 5.82% 11.93% 5.60% -3.46%

Charts

1.  Daily S&P 500 (C Fund Proxy)

2.  Daily EFA (I Fund Proxy)

3.  Daily Wilshire 4500 (S Fund Proxy)

4.  Daily AGG (F Fund Proxy)

Get The Full Picture

Weekly Wrap Up

From Briefing.com
Newsletter 10/31/14

Quick Recap of the Week

The stock market started the week with a small loss on Monday. After that, it went into rally mode. The biggest news event was the Federal Reserve’s policy statement. As expected, the Fed announced the end of their current round of quantitative easing (QE). However, the Fed also said it would maintain its 0% funds rate for a “considerable time.”

While stocks dropped slightly that day, they bounced back strongly on Thursday. On Friday, the Bank of Japan said they were boosting their own asset-purchasing program. This led to an overseas rally that extended to U.S. markets.

The S Fund had the largest gain of 3.40%. It was followed by the I Fund (3.11%) and C Fund (2.74%). The F Fund fell by 0.21%.

  • YTD Return as of 10/31/14: -0.19%
  • Current allocation: 100% C Fund as of 11/3/14
  • New Trades: IFT from 100% G Fund to 100% C Fund before noon EST on 11/3/14

TSP Fund Performance (10/31/2014 YTD)

G Fund F Fund C Fund S Fund I Fund
1.95% 5.73% 11.06% 5.34% -1.69%

Charts

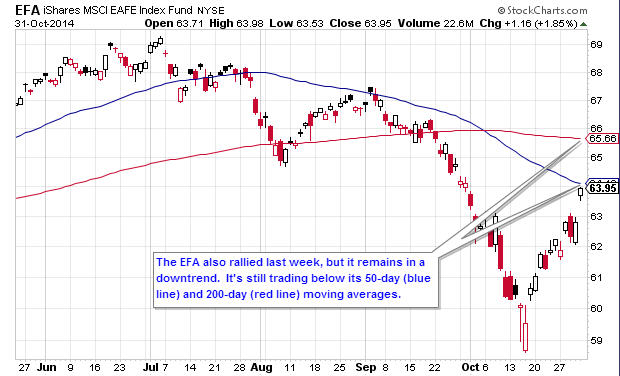
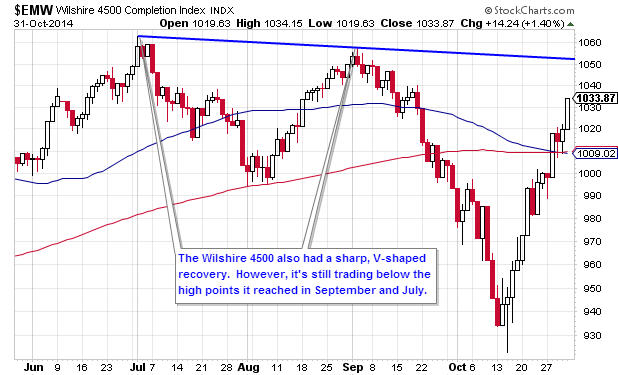
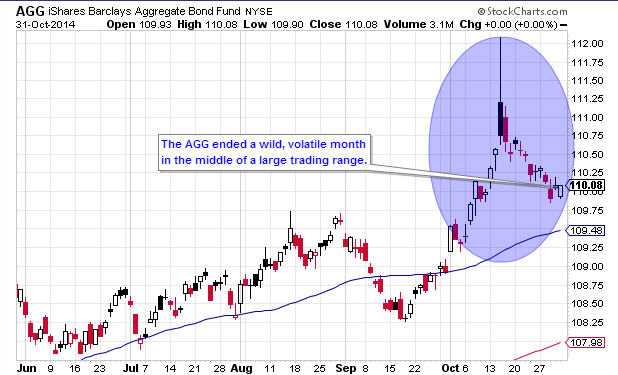
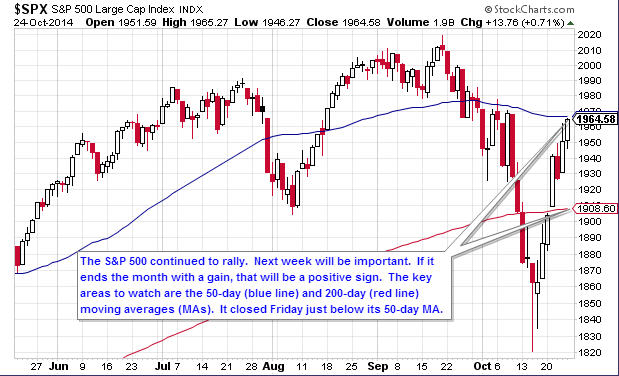
1.  Daily S&P 500 (C Fund Proxy)

2.  Daily EFA (I Fund Proxy)

3.  Daily Wilshire 4500 (S Fund Proxy)

4.  Daily AGG (F Fund Proxy)

Get The Full Picture

Weekly Wrap Up

From Briefing.com
Newsletter 10/24/14

Quick Recap of the Week

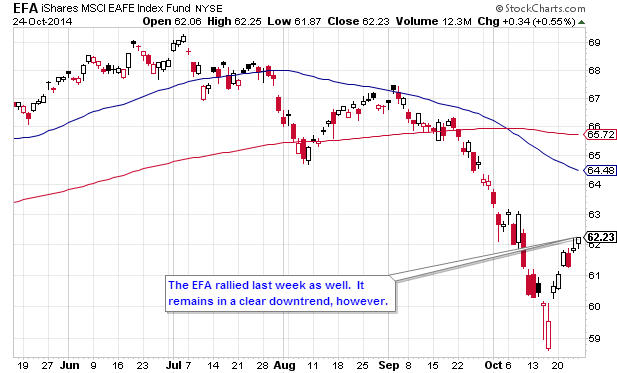
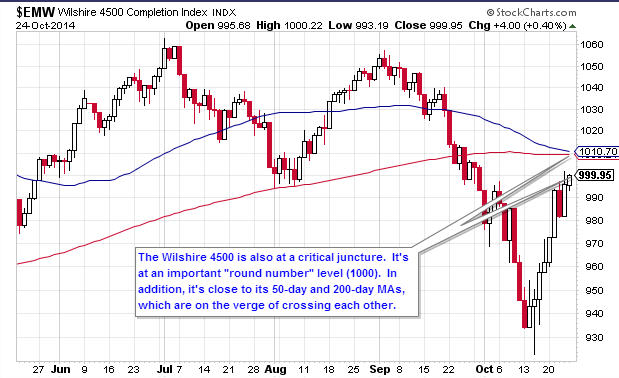
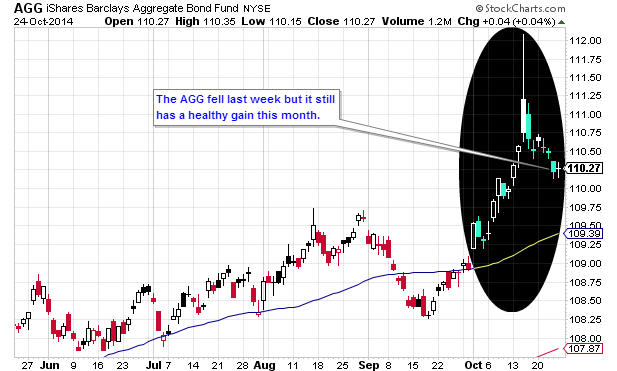
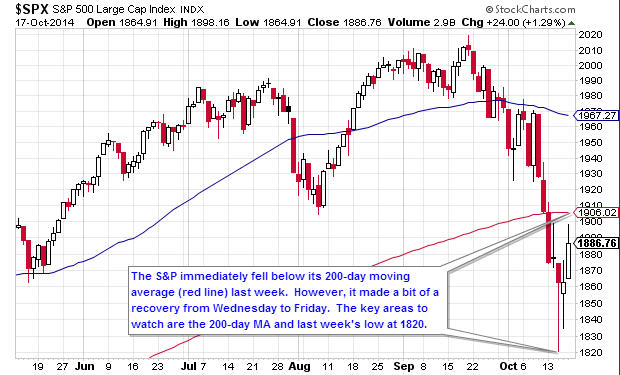
Stocks moved up last week. The rally began with better-than-expected earnings for several companies. After a mid-week slump, some good economic reports from overseas lifted the market. The S Fund had the best performance with a 5.81% gain. The C Fund was next, advancing by 3.10%, followed by 2.28% for the I Fund. The F Fund increased by 0.17%.

  • YTD Return as of 10/24/14: -0.24%
  • Current allocation: 100% G Fund as of 10/1/14
  • New Trades: None

TSP Fund Performance (10/24/2014 YTD)

G Fund F Fund C Fund S Fund I Fund
1.90% 5.95% 8.10% 1.87% -4.65%

Charts

1.  Daily S&P 500 (C Fund Proxy)

2.  Daily EFA (I Fund Proxy)

3.  Daily Wilshire 4500 (S Fund Proxy)

4.  Daily AGG (F Fund Proxy)

Get The Full Picture

Weekly Wrap Up

From Briefing.com
Newsletter 10/17/14

Quick Recap of the Week

After a bad start, stocks recovered some of their losses last week. The markets moved in response to a large number of economic data releases. Overall, the data had mixed results, with no clear picture emerging. The S Fund had the best return for the TSP, increasing 1.72%. The F Fund followed with a 0.41% gain. The I Fund fell by 0.1% while the C Fund lost 1.0%.

  • YTD Return as of 10/17/14: -0.28%
  • Current allocation: 100% G Fund as of 10/1/14
  • New Trades: None

TSP Fund Performance (10/17/2014 YTD)

G Fund F Fund C Fund S Fund I Fund
1.86% 6.21% 3.80% -2.07% -6.87%

Charts

1.  Daily S&P 500 (C Fund Proxy)

2.  Daily EFA (I Fund Proxy)

3.  Daily Wilshire 4500 (S Fund Proxy)

4.  Daily AGG (F Fund Proxy)

Get The Full Picture

Weekly Wrap Up

From Briefing.com
Newsletter 10/10/2014

Quick Recap of the Week

For the third straight week, all of the major stock indices fell.  The S Fund had the biggest loss among TSP funds.  It declined 4.76%.  The C Fund fell 3.09% while the I Fund dropped 2.96%.  The F Fund rose 0.69% as bonds were seen as a safe haven.

  • YTD Return as of 10/10/14: -0.33%
  • Current allocation: 100% G Fund as of 10/1/14
  • New Trades: None

TSP Fund Performance (10/10/2014 YTD)

G Fund F Fund C Fund S Fund I Fund
1.81% 5.77% 4.85% -3.72% -6.78%

Charts

1.  Daily S&P 500 (C Fund Proxy)

2.  Daily EFA (I Fund Proxy)

3.  Daily Wilshire 4500 (S Fund Proxy)

4.  Daily AGG (F Fund Proxy)

Get The Full Picture

Weekly Wrap Up

From Briefing.com
Newsletter 10/3/14

Quick Recap of the Week

Stocks fell after another volatile week of trading. Protests in Hong Kong set a cautious tone on Monday. Investors continued to sell until mid-day on Thursday. At that time, stocks began to rebound. This continued on Friday, as employment data was better-than-expected. This reversal may have been a “technical bounce,” however, as stocks had become very oversold. We should find out more next week.

The I Fund was hit the hardest, falling by 3.42%, followed by the S Fund’s 1.30% loss. The C Fund dropped 0.72%, while the F Fund gained 0.41%.

  • YTD Return as of 10/3/14: -0.37%
  • Current allocation: 100% G Fund as of 10/1/14
  • New Trades: None

TSP Fund Performance (10/3/2014 YTD)

G Fund F Fund C Fund S Fund I Fund
1.77% 5.04% 8.19% 1.10% -3.93%

Charts

1.  Daily S&P 500 (C Fund Proxy)

2.  Daily EFA (I Fund Proxy)

3.  Daily Wilshire 4500 (S Fund Proxy)

4.  Daily AGG (F Fund Proxy)

Get The Full Picture

Weekly Wrap Up

From Briefing.com